


Let me guess what brings you to this article: You've been told to "improve product adoption." by your boss. Now you're googling around what that actually is and how to increase it. Now you found this article, hoping it'll save you.
First, the bad news: We can't perfectly define product adoption. The good news: No one else can, either (not even your boss).
Look, there are a gazillion ways to define product adoption. Some of them are non-meaningful vanity metrics, and others actually capture what all product teams are trying to do: deliver value to customers.
Here are 10 of the latter variety to help you measure product adoption. At the end of this post, we'll talk about meaningless product adoption metrics that you should handle with caution.
- Onboarding completion rate
- Time-to-value
- Feature adoption rate
- Feature retention rate
- Engagement rate
- Usage frequency
- Churn
- Retention
- Customer lifetime value (CLV)
- NPS
Some advice
It's important to track product adoption metrics over a period of time to understand trends that are specific to your business. User adoption, feature adoption rates, and customer satisfaction can vary wildly from business to business. "Good" is usually relative to your own product's history, not some other product that may have a completely different product adoption strategy.
Throughout this article, we'll discuss some ways to improve adoption if your product adoption metrics look sad. Many of these tactics are also discussed in our content on user onboarding and eliminating friction.
Onboarding-related metrics
These first set of metrics deal mostly with new users. These are obviously important users to nurture, as they're the driver of your business's growth. Your goal should be to turn new users into happy, active users. Don't neglect existing users, though (we'll discuss those later on).
Onboarding completion rate
Onboarding completion rate measures the percentage of new users who make it through your product's onboarding process. In order to track this example product metric, you need to have a clearly defined onboarding process. Onboarding typically starts when a user signs up. The tricky part is you need to know what "completed onboarding" means to define the number of users who completed onboarding.
Some common definitions for completed onboarding are:
• Completed an assigned checklist of steps. If you use a product onboarding tool, you might have defined an onboarding checklist of steps for your new user to complete. These steps might show the user different parts of your app and its key features and/or require them to complete setup steps. Hopefully, you have multiple checklists personalized to different personas!
• Completing a key setup action. Sometimes, products have a critical setup step, without which they can deliver no value. For example, if you work on a product analytics tool, you probably need your users to connect to Segment or another customer data platform (CDP) before data can start flowing into your product, and you'll be able to deliver valuable insights. For a social product, this step might include inviting friends or finding friends in the network.
You might see the onboarding completion rate go by another name: activation rate. "Activation" is a common way to describe the process by which a user goes from a new user to an engaged user, the "activation point." However, it doesn't measure ongoing engagement or product adoption.
Time-to-value
Time-to-value is similar to the onboarding completion rate in that it relates specifically to new users. However, the quantity of interest here is time, how long it takes your users to get up and running and "find value."
Sometimes, you'll define "find value" the same way you define onboarding completion. However, in other situations, it might make sense to use a different definition. Going back to our analytics example, once a user gets their data into your product, they haven't actually gotten value out of it in the form of new insights; they're just one step closer. In this case, it could make sense to define "value" as the moment the user creates their first chart. The specific point in the user journey that corresponds to value will differ from product to product. If you don't know where it is, consider using a product adoption tool to ask your users!
Essentially, you want this number to be as small as possible. Ideally, users can find value quickly. This is important for two reasons. First, a long time-to-value risks users getting stuck and abandoning your product. This is especially true for PLG products. Second, it can correlate with a low retention rate. If users spend a lot of time getting up and running, they are off to a bad start.
A long time-to-value can reveal friction points in your onboarding process that you'll want to iron out.
Feature metrics
You can turn to these metrics if you want to evaluate a particular feature. They can also be useful to understand your user base. If you have a lot of users using some features but not others, that can inform the strategy of other teams like customer success and product marketing.
Feature adoption rate
Feature adoption rate measures how many customers use a feature. To measure this, you'll need to define a few things. First, you'll need to define the denominator. Make sure only to include users who have access to a feature. For example, if you want to measure the feature adoption rate for a feature that's only available on a paid plan, make sure you exclude free users from your denominator. Second, you'll need to have the tools in place to track user behavior and decide what it means for a feature to be used.
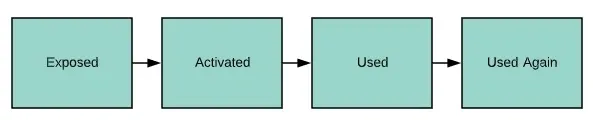
You may, for example, decide that "used" means "used in the last month" instead of "used ever." There is a big difference between a feature that customers actively use on a regular basis versus one they tried and decided wasn't valuable to them. As you've seen throughout this article, there are many nuances to product usage, but an understanding of the feature adoption funnel can help you navigate it.
Because feature adoption rate focuses on current usage, its best used to evaluate new features. For example, one month after a new feature release, a high feature adoption rate tells you that the launch was probably a success.
Feature retention rate
Similar to the feature adoption rate, this metric is used to measure the health of a feature. What makes it especially useful is that it can tease out product features that have been abandoned by your users (and are ripe for unshipping!). Instead of measuring how many users are using a feature, it measures how many users are using the feature consistently.
Calculating this metric is a bit harder than the others. First, pick a time period. For example, 1 year. Next, find all the users who used the feature one year ago. That's your denominator. Next, calculate users who are currently using the specific feature. That's your numerator. The higher this number, the more users depend on this feature.
The difference between a low feature adoption rate and a low feature usage rate is that the former doesn't tell you why the feature has low adoption -- it could be low awareness or because the feature wasn't useful. A low feature retention rate implies the feature needs to deliver more value to be useful.
Because this metric can be harder to calculate, we recommend using product analytics tools like Amplitude or Heap to get the job done. In fact, you should probably create a dashboard with all of your key metrics in one of those tools if you have access.
Engagement metrics
These metrics capture how engaged your user base is. A user base of happy, engaged users is much more valuable (and hard to build!) than a user base of users who log in infrequently. Common terms in this category are daily active users (DAU), weekly active users (WAU), and monthly active users (MAU).
Engagement rate
Engagement rate measures the activity of your user base. There are many ways to measure this, but we prefer the following method: divide your DAUs by your MAUs. This will be a number between 0 and 1 since every DAU is a MAU, but not every MAU is a DAU.
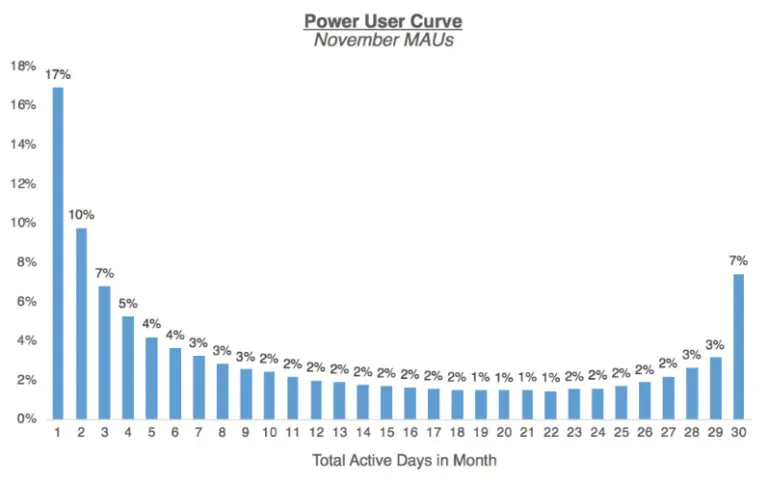
This product adoption metric captures the usage frequency of your user base. If the number of users who are DAUs is similar to MAUs, then most of your users are very engaged, and your user engagement rate is high. If not, your customer success team should unpack why product usage is infrequent. There may be good reasons for it, but generally, the best products create reasons for customers to come back frequently. Lower engagement rates correlate with shorter average customer lifespan and lower customer retention. If you plot this usage rate over time, then it can also help you to identify your power users.
Usage frequency
Usage frequency measures the percentage of your total user base who accessed your product in a specific period. For example, if you've had 1 million users log into your product ever, and 10,000 logged in last month, your monthly usage frequency would be 1%.
Like with engagement rate, higher usage frequency usually means higher customer loyalty and means you are probably doing a good job retaining customers. Low usage frequency almost always means poor user retention.
Funnel metrics
Sometimes, the right product adoption metrics are the ones that are closest to the money.
Churn
Churn measures the % of your userbase that leaves your product in a period. "Leaves" could mean they stopped using the program or stopped paying.
Ideally, you want to measure product adoption in a way that allows you to anticipate churn before it happens. Certain user adoption metrics can predict churn better than others. For example, a low net promoter score (NPS) can often be a sign of upcoming churn, especially if the dip happens quickly. Another trick is to look at feature adoption across a set of features in a user cohort. If you notice that a group of users is not using very many relevant features, it might be the case that they are likely to churn (unless they are new users who haven't had time to explore yet fully).
Retention
Retention is just the opposite of churn. Of all the product adoption metrics, it's the most important to track on a regular basis because strong retention rates are the basis of every software business. It has a huge impact on your SaaS magic number as well. You can't optimize any of the other metrics if your retention rates are low. Of all the metrics to track, we recommend you keep tabs on this one.
Customer lifetime value
Customer lifetime value, often abbreviated CLV, is a summary metric that incorporates many of the most important indicators of product adoption. Unfortunately, it's also the trickiest to calculate.
First, you'll need to measure customer lifetime. This is the expected duration of a customer relationship. To do this, take your retention rate and divide 1 by it. For example, if your annual retention rate is 90%, your average customer lifetime is 1/0.9 = 10 years. Note that customer lifetime is not the same thing as average session duration, which measures the lifetime of a particular session.
Next, to calculate the value, you'll need to figure out how much a customer pays you per period (in our example, year). This becomes complicated by the fact that a customer's bill might grow or shrink based on their product adoption! Lots of usage means there may be an upsell opportunity.
Sum up the stream of payments you expect your customers to make to you, and that's your customer lifetime value.
If you want to get really fancy and impress people, you can discount future payments using an interest rate. This captures the fact that payments in the future are less valuable than payments today.
Net Promoter Score (NPS)
Why is NPS in the "Funnel metrics" section of this article? Because it is often predictive of many problems with product adoption that show up in other metrics.
You can calculate NPS overall for your product or for a specific feature. If you're using a product adoption tool with survey functionality, you can target users who've used a specific feature to gauge user sentiment. Or you can target users after users complete an onboarding milestone to identify potential friction points.