


Every product person knows that user experience analytics are the lifeblood of a product strategy. Ship, listen to users, adjust, repeat. The goal is to learn from high quality data to produce better user experience, retention, and overall satisfaction.
Most teams spend a TON of time analyzing the data they’ve collected. And very little time reassessing HOW they collect that data. This ignores the fact that most common ways of measuring user experience, particularly on the qualitative side, are often fairly ineffective in gauging true behavior and sentiment. especially when users are surveyed or queried using intrusive elements like untargeted pop-ups (we’ve all experienced these as end users!)

When you query users in suboptimal ways, you introduce a host of problems — lower response rates, selection bias (getting feedback only from your most patient users), and lower quality user recollection (asking them about stuff they experienced 3 weeks ago instead of just right now). Not to mention, interruptive feedback collection makes the underlying product experience feel less polished and less protective of the user’s time.
To better serve your users and to improve the quality of your data, you can shift from a passive set-and-forget UX analytics approach to a mixed and proactive engagement campaign that collects higher-quality data in less annoying ways. The keys to doing this are (1) using finely-targeted in-app messages instead of untargeted pop-ups and (2) introducing native channels (e.g. with tools like Copilot) for collecting user intent in their own words.
These are easy to set up, and together they'll give your team an enhanced understanding of user roadblocks, deadends, and frustrations, which you can use to improve their experience.
Here’s a quick glimpse of what we’ll cover in the article:
- User experience analytics metrics
- Avoiding the passivity pit in UX analytics collection
- How to go beyond simple surveys and improve your qualitative user analytics insights
- Go beyond data collection — find hidden qualitative user analytics insights
- Frequently Asked UX Analytics Questions
Now, let’s dive in.
User experience analytics metrics
There are hundreds of metrics that you can look at to understand how users interact with your product, so it can help to break them up into groups. First, we can look at qualitative vs. quantitative metrics.

Qualitative metrics
Qualitative data is subjective and is always sourced by engaging with the user. The most common forms of engagement are surveys, user interviews, and other direct feedback forms. This data is much more in depth and offers more specific insights, but it is also more difficult to gather qualitative data at scale.
Examples: NPS Scores, Recorded Interviews, CES Scores.
Platforms: CommandBar, Qualtrics, SurveyMonkey.
Quantitative metrics
Quantitative data is numeric and is gathered automatically by your analytics platform. There are hundreds, if not thousands, of data points that fall under this category, which can actually make it challenging for teams to understand what to focus on.
Examples of Metrics: User Activation Rate, Session Duration, Bounce Rate.
Platforms: Google Analytics, Amplitude, HotJar, Embeddable.
Avoiding the passivity pit in UX analytics
If you're like most product teams, most of your quantitative user experience analytics are fully automated through a platform like Qualtrics or Hotjar. You can check your dashboard for the latest numbers, set up experiments, and examine every little data point to your heart's desire.
Now, to be clear, I'm not saying that that's a bad thing: data is powerful and the more you have, the more accurate it becomes.
When it comes to quantitative data, running collection in the background makes a lot of sense.
— Paul Thomson (@thepaulthomson) October 25, 2023
But when you're looking for qualitative data or quantitative data with more context and direct input from users, you need to be very intentional about how you design the feedback experience.
You're relying on that data to make super important product decisions that affect every facet of your users' experience.
Yet, when was the last time you evaluated the ways that you actually collected that data, not just the data itself?
Passive prompting
The issue with passive and untargeted prompting is that users are often queried at random or at inopportune moments.
Imagine your user is in the middle of flow state, and they're absolutely grooving with your product and solving a difficult problem.
They're halfway through this when they're suddenly hit with a large, intrusive survey. Or worse, an ambiguous request for feedback that isn’t quick and easy:
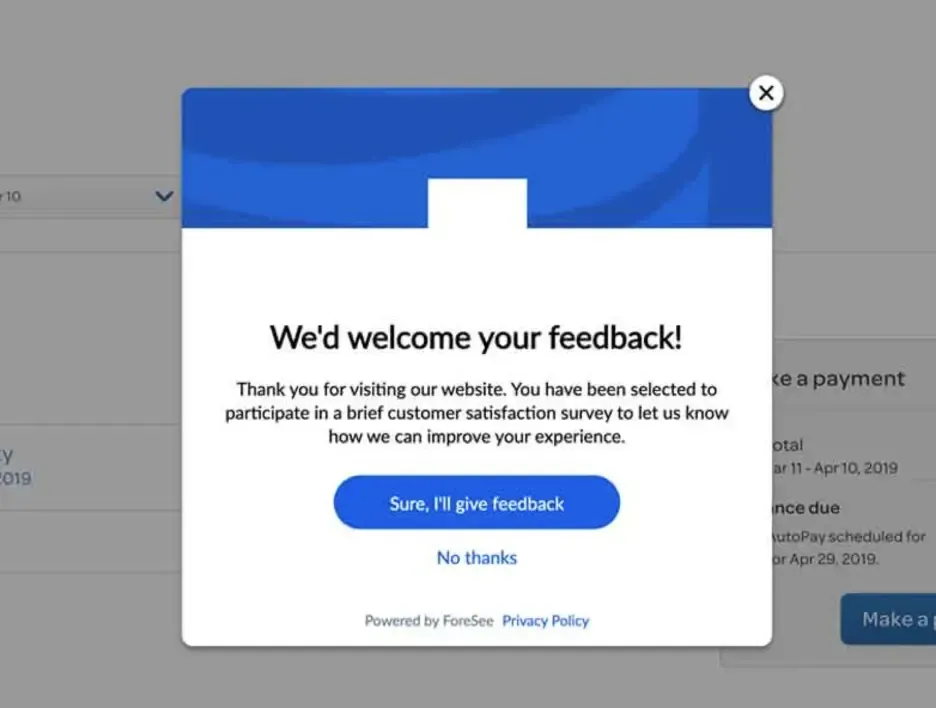
Ignoring that pop-up doesn't necessarily mean they're not satisfied with your services. It just means it's not the time to ask them. And c’mon, who wants to interrupt someone’s flow state!

So, what is the best way to gather this data in an unintrusive way?
How to go beyond simple surveys and improve your qualitative user analytics insights
When you take a proactive and customized approach to qualitative user experience analytics gathering, you enable your users to fully experience your software without friction by only prompting them for feedback at the right time. Unlike blanket pop-ups with randomized or non-customized triggers, custom in-app messaging can be set up to trigger only after specific events by specific users at specific times or to manifest only in light nudges.
So, how do you do this for your surveys, NPS, and feedback questions?
There are easy ways to improve the timing and targeting of your nudges and feedback requests within CommandBar. Controlling which users see what, at the right times and locations i
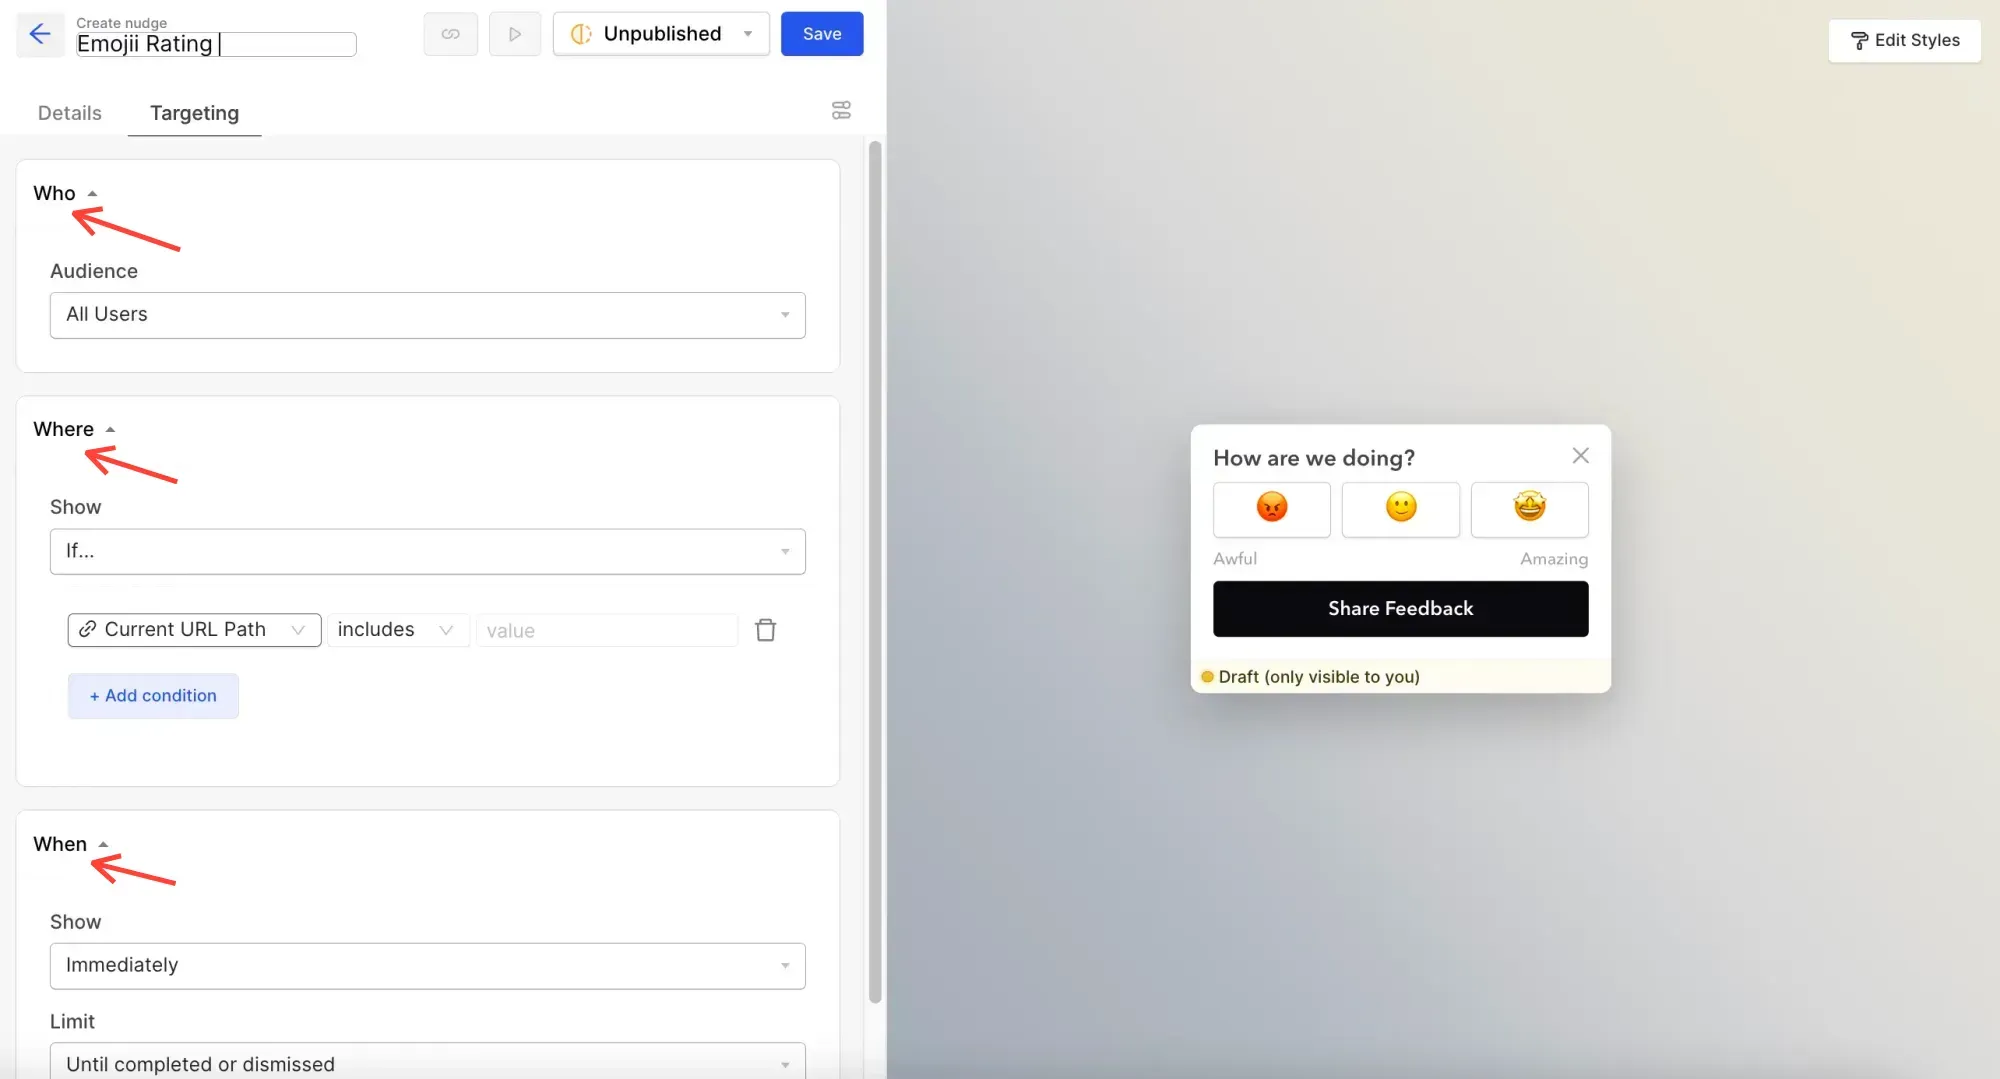
You can easily set up surveys to trigger only after very specific criteria.
One example could be a time-based smart delay trigger, which will only appear after a certain number of visits and after a certain amount of time in product.
Go beyond data collection — find hidden qualitative user analytics insights
When you pair a comprehensive quantitative analytics collection strategy with a proactive and targeted, user-friendly qualitative feedback approach, you can get some great results.
But there are even more powerful ways for you to unearth hidden blockers and intent from your users to better optimize your product.
When your users interact with tooling like CommandBar’s HelpHub or Copilot, they are seeking answers to their most salient and time-sensitive questions. Often, they'll find what they're looking for quickly, and you can use this as validation of both your UX flows and your resources available.
But sometimes, that search and journey is not as easy, and users will get frustrated, distracted, or even angry with their inability to solve their problems.
By analyzing the user's interactions with these AI-powered tools and studying where fall off, blockages, and deadends, you can get a better handle on what is really bothering users.
Instead of extrapolating insights from more ambiguous metrics like bounce rates, session duration, or engagement, you can read in text in Copilot chat history:
- What folks are looking for and asking about
- What is served to them, and how they engage with it
- How they further interact (or fail to) with that content
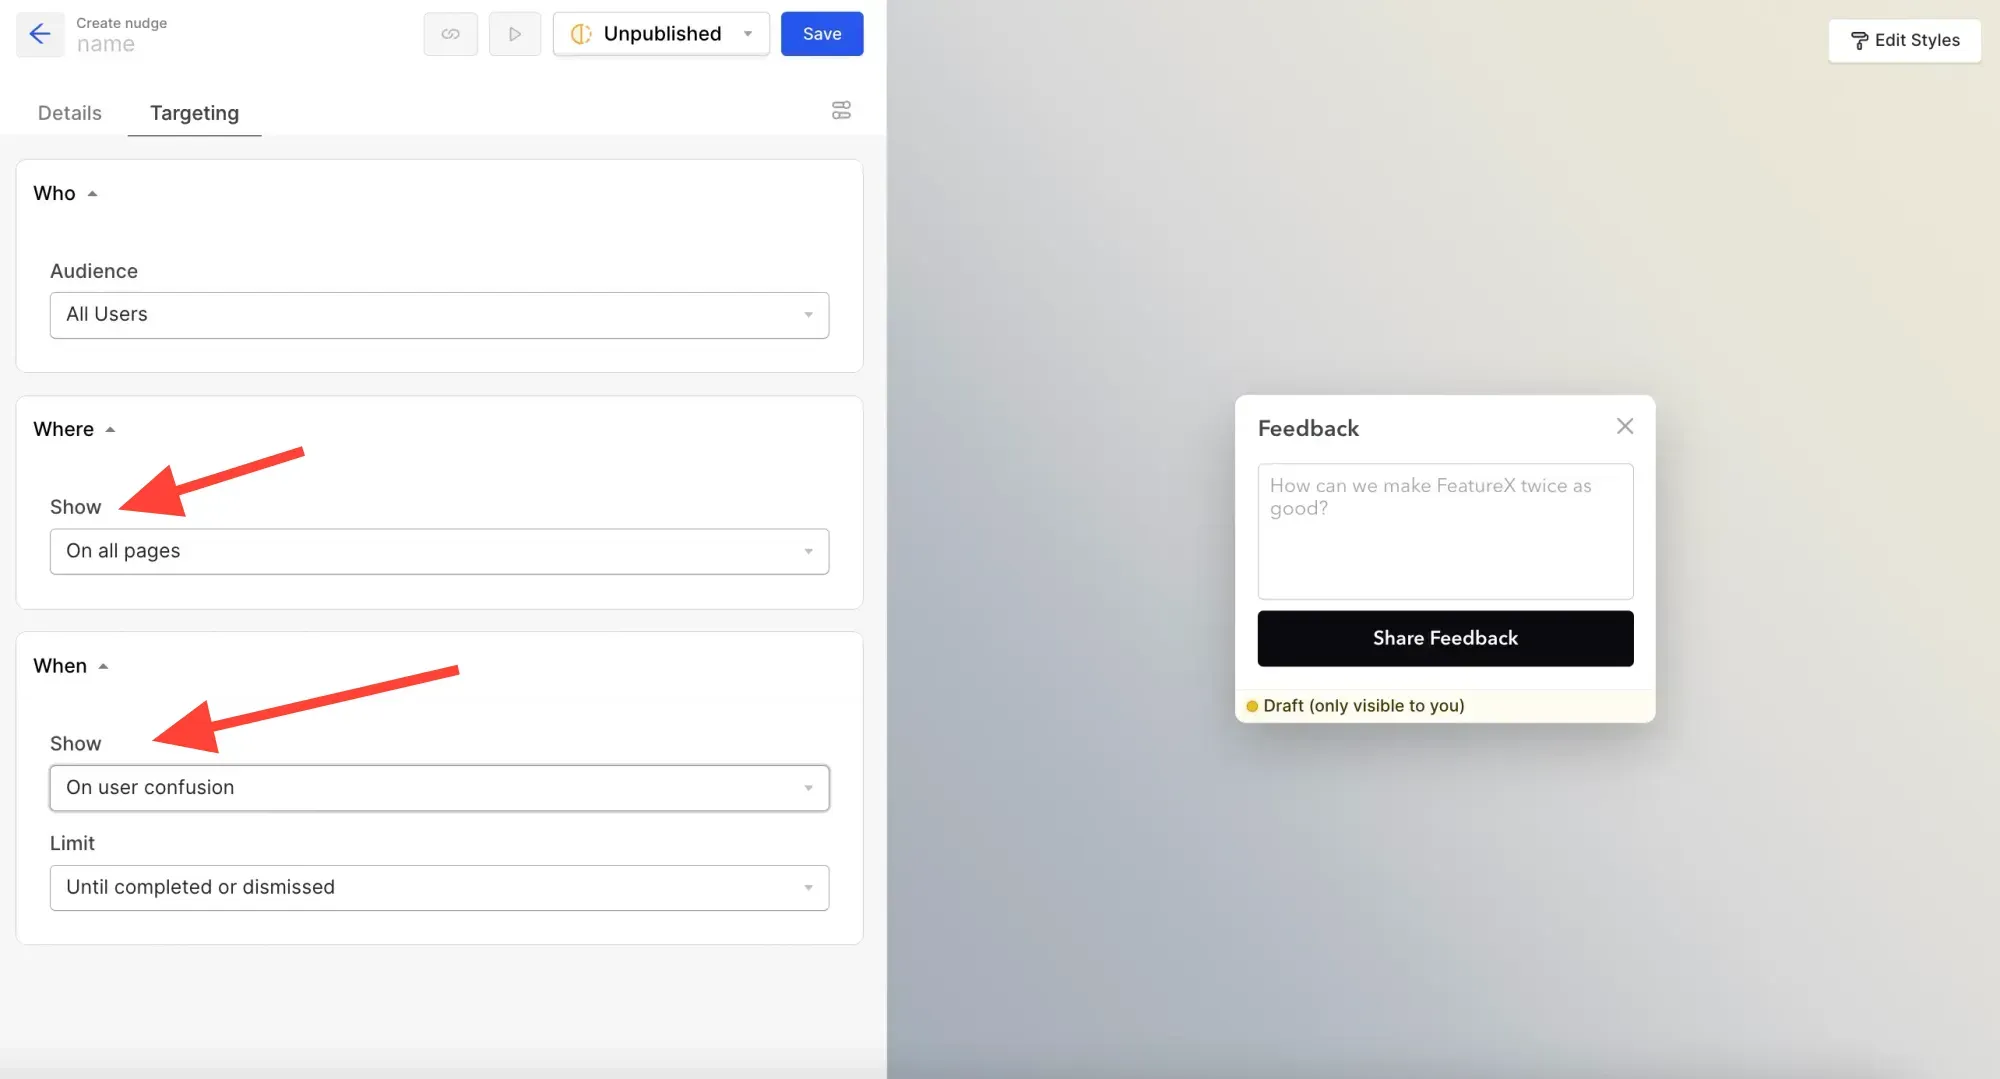
You can also take this even one step further and add in a light nudge for feedback after a user's interaction with Copilot.
CommandBar has built some amazing targeting options for you to better address user needs.
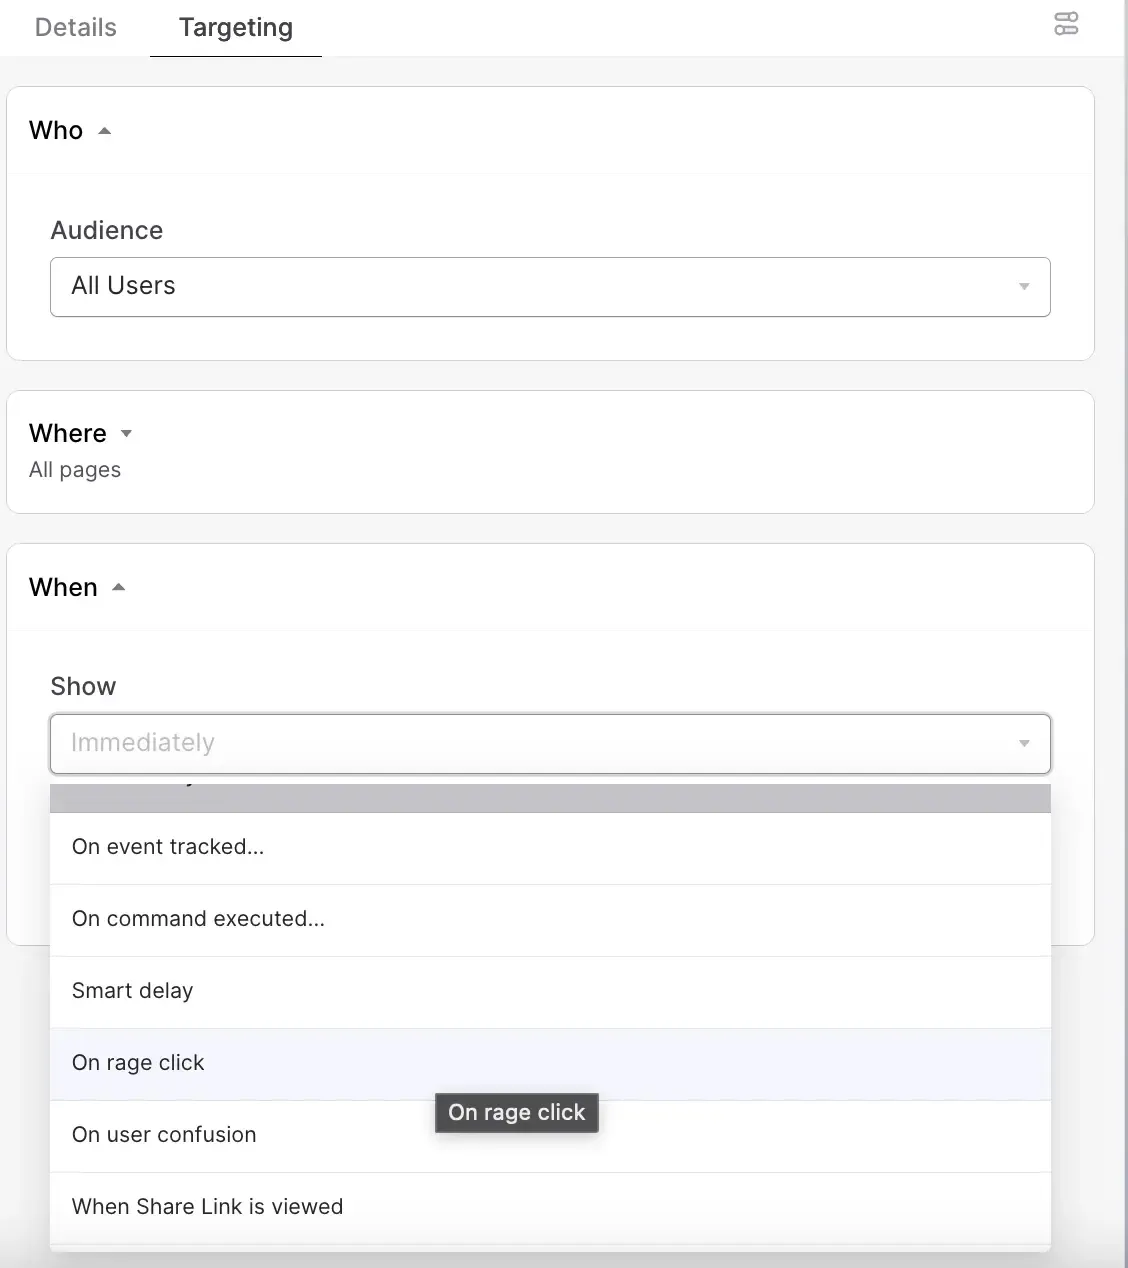
Now, you can set up targeting for your nudges and other feedback loops on specific frustration mechanisms, like rage-clicking around the screen. This is an extra layer of sophistication for your targeting that will allow you to get feedback quickly from users in need and improve your product experience for better outcomes.
Conclusion
The best way to succeed in gathering user experience analytics is to take a nuanced and intentional approach to not only the metrics you want to measure but also the way you choose to collect them. When you avoid passive and blanketed intrusive pop-ups and surveys and opt for hyper-targeted and smart nudges, you not only get better data, but you also provide a better end-user experience that produces better retention and can improve metrics like your SaaS magic number. Combining this approach with qualitative insights from dead ends and roadblocks in tools like Copilot will allow you to make your UX analytics easy to digest, smoother to collect, and perhaps even somewhat fun to engage with (yes, it’s possible) when paired with a high-quality quantitative analytics platform.
Frequently Asked UX Analytics Questions
Why Are User Experience Analytics Important for Product Improvement?
User experience analytics are crucial for gaining insights into user interactions, leading to enhanced satisfaction, retention, and product enhancement.
Difference Between Quantitative vs. Qualitative UX Metrics
Quantitative metrics are automatically collected data, while qualitative metrics involve subjective insights gathered through direct user engagement.
How Can UX Analytics Enhance Product Design?
UX analytics offers valuable data that informs design decisions, prioritizes feature development, and fosters user-centered design.
Key Methods in User Experience Analytics
Common methods include surveys, usability testing, user interviews, A/B testing, and behavioral analytics tools.
Most Popular UX Methodologies for Effective Product Design
Common UX methodologies include User-Centered Design (UCD), Design Thinking, Lean UX, Agile UX, and Participatory Design.
Distinguishing UX Analytics from Data Analytics
UX analytics focuses on improving user experience, while data analytics is a broader field used for various purposes, including business intelligence.
Role of a UX Data Analyst
A UX data analyst collects and analyzes user data to provide insights that inform design decisions and create user-centric products.
UX Designers and Data Analytics Knowledge
While not a strict requirement, basic data analytics knowledge can be valuable for UX designers, aiding in data-informed design decisions.
UX Key Performance Indicators (KPIs)
UX KPIs include User Activation Rate, Task Success Rate, User Retention Rate, Net Promoter Score (NPS), and Conversion Rate, measuring various aspects of user experience.
The Five Major Elements of UX
The five major elements of UX encompass usability, accessibility, desirability, credibility, and value, collectively shaping a positive user experience.