


There are some stuff you can debate forever—what's the meaning of life? Is God real? And when is a product successful?
You could measure your product's success with many different metrics—signups, free-to-paid conversion, product adoption rate, monthly active users...
There's no single answer for all products: How you measure success needs to flow from your unique product. That's why we've collected a lot of examples of great product metrics that fast-growing startups use to measure their success. In this example, you'll discover the best ones we found.
Some might imagine that most companies today glide through product questions. They just pull on an array of key metrics that make the correct decision obvious. After all, it is easier than ever to collect product data!
- There is an abundance of tools for collecting and measuring data across each imaginable aspect of a product.
- You can track users (even before signing in), replay user sessions, dive into the most granular product interactions, and attach any user or event attribute to your data.
- You can use an ELT/ETL data pipeline to get your data into any number of business intelligence tools to build dashboards and distill findings.
It's also hard some times to clarify what real product success looks like!
When one or more of these things happen to you, you should know that you are becoming SUCCESSFUL as a Product Manager.
— JustAnotherPM | Sid (@JustAnotherPM) January 11, 2024
In the short term:
1. Your product is successful:
Your product metrics are moving in the right direction, you are meeting/exceeding your goals.
2. Promotions… pic.twitter.com/oqqSfHgteK
But time and time again, companies report that they are not making data-informed decisions. What gives? Unfortunately, this is a classic example of the titular concept from Barry Schwartz's book "The Paradox of Choice." At its core, Schwartz argues that eliminating choice improves the customer experience. The same principle applies to the world of product metrics. Companies are collecting more data than ever. Instead of finding clarity, teams are increasingly overwhelmed by their data. In today's world, where data is pouring from every corner, it is fundamental to figure out how to cut through the noise and focus on what matters.

Contents:
- Why do product metrics matter?
- How to pick the right metrics for your product
- Types of product metrics
- Useful product metrics examples
- Tying a bow
Why do product metrics matter?
As a product manager, designer, or founder, it’s essential to understand how your product is performing. Without metrics, you are basically operating off instinct. If you are pre-product, then I appreciate you doing your homework and reading, but obviously, you have no product metrics to operate with. If you have a live product with real customers, then ignoring customer/product data is squandering a golden opportunity. This is why so many product teams have become obsessed with product metrics and product OKRs.
The right set of product metrics gives your team x-ray vision. Complex questions can be dissected and solved with the right tools -- product metrics.
- Where does the product meet the mark?
- Where does the product fall short?
- Where are customers finding value?
- What features or improvements should we prioritize to improve x, y, and z?
- What "aha" moments are users missing out on?
- How can we improve our customer satisfaction score?
Product metrics provide instant insights into the status of your product, whether you're launching them for the first time or working on v83. Rather than battling with purely subjective opinions, your team can land on the right answer faster with data-driven, or at least data-informed, discussions.
How to Pick the Right Metrics
First, it is important to note that you cannot effectively track everything. If everything is important, then nothing is important. It is acceptable and necessary to draw a line in the sand -- "We are only tracking these things."
Second, with so many metrics to choose from, it can be overwhelming to decide which ones to focus on. Here are some guiding questions to pick the right metrics.
What metrics indicate success for your product?
There is not a one-size fits all solution to metrics. Your company type and business model have everything to do with which metrics you should prioritize.
- If you are a social media company like Facebook or Twitter, then customer retention and engagement metrics are critical
- If you are an infrastructure provider, like AWS or Azure, then you might care more about feature adoption and average revenue
- Food delivery service providers, like DoorDash, value time to checkout and customer satisfaction
How will the metrics be used or delivered?
It's important to consider two sub-questions here:
- Who are you sharing the data with?
- How are you planning to use the data?
If you are an early-stage founder that is trying to understand the high-level status of your product, then it is likely overkill to focus on the click rate of various in-app buttons and the time spent on specific features. It might be more valuable to understand your conversion funnel and identify drop-off points.
If you are a junior analyst on a product team, then you might be focused on the nitty-gritty of product performance metrics. Knowing that only 5% of users are trying the team's new feature is a great indication that more should be done to highlight the feature via in-app messaging or in-app guides.
If you are part of a team where the CEO, CPO, or CRO is laser-focused on a specific metric, your efforts might be best spent dissecting the leading indicators for that metric. For example, if there is a recent focus on user intent, it is critical to ensure your key performance indicators reflect the outcomes of leveraging user intent.
Types of Product Metrics
There are many product metrics frameworks to choose from. One popular framework is the Pirate Metrics Framework. What do metrics have to do with pirates? You might be disappointed to learn that the name comes from the acronym "AARRR" of its five pillars -- Acquisition, Activation, Retention, Referral, and Revenue.

This framework is focused on customer-oriented metrics. Each piece inspects a different aspect of the user journey, moving from the first sign of interest in your product to winning business from your customer. These categories provide a nice introduction to types of product metrics.
- “Acquisition”: attracting new customers
- “Activation”: converting those customers into engaged users
- “Retention”: keeping users engaged over the long term
- “Referral”: turning users into advocates who bring in new customers
- “Revenue”: generating profit
To simplify a bit, we'll consolidate the above into three buckets:
- Product usage and engagement -- a combination of Activation, Retention, and Referral
- Customer satisfaction -- a combination of Retention and Referral
- Financial -- a combination of Acquisition and Revenue
Useful product metrics examples
Let's dive into actually useful product metrics based on the categories above.
1. Product usage and engagement
Active users
Active users are most commonly measured by day or month. Daily active users (DAUs) and monthly active users (MAUs) are the number of users that use your product during the specified time period.
Active user count gives you a bird's-eye view of your product.
- When your number of active users increases, your product is doing well and can be used to identify and measure power users, for example.
- When your number of active users decreases, something is likely going wrong (or it's just a holiday lull).
Useful for a higher-level pulse check, active user counts do not produce targeted conclusions since they are often influenced by various other factors (e.g., customer retention, marketing spending, product/feature launches).
Click-Through Rate (CTR)
CTR measures the percentage of people that click on a call-to-action button, whether in-app or in a marketing email. A higher CTR indicates that the messaging is resonating with the target audience.
Conversion Rate
Conversion rate measures how many people completed a target flow. For example, the percentage of users that visited your product who actually created an account.
Feature adoption rate
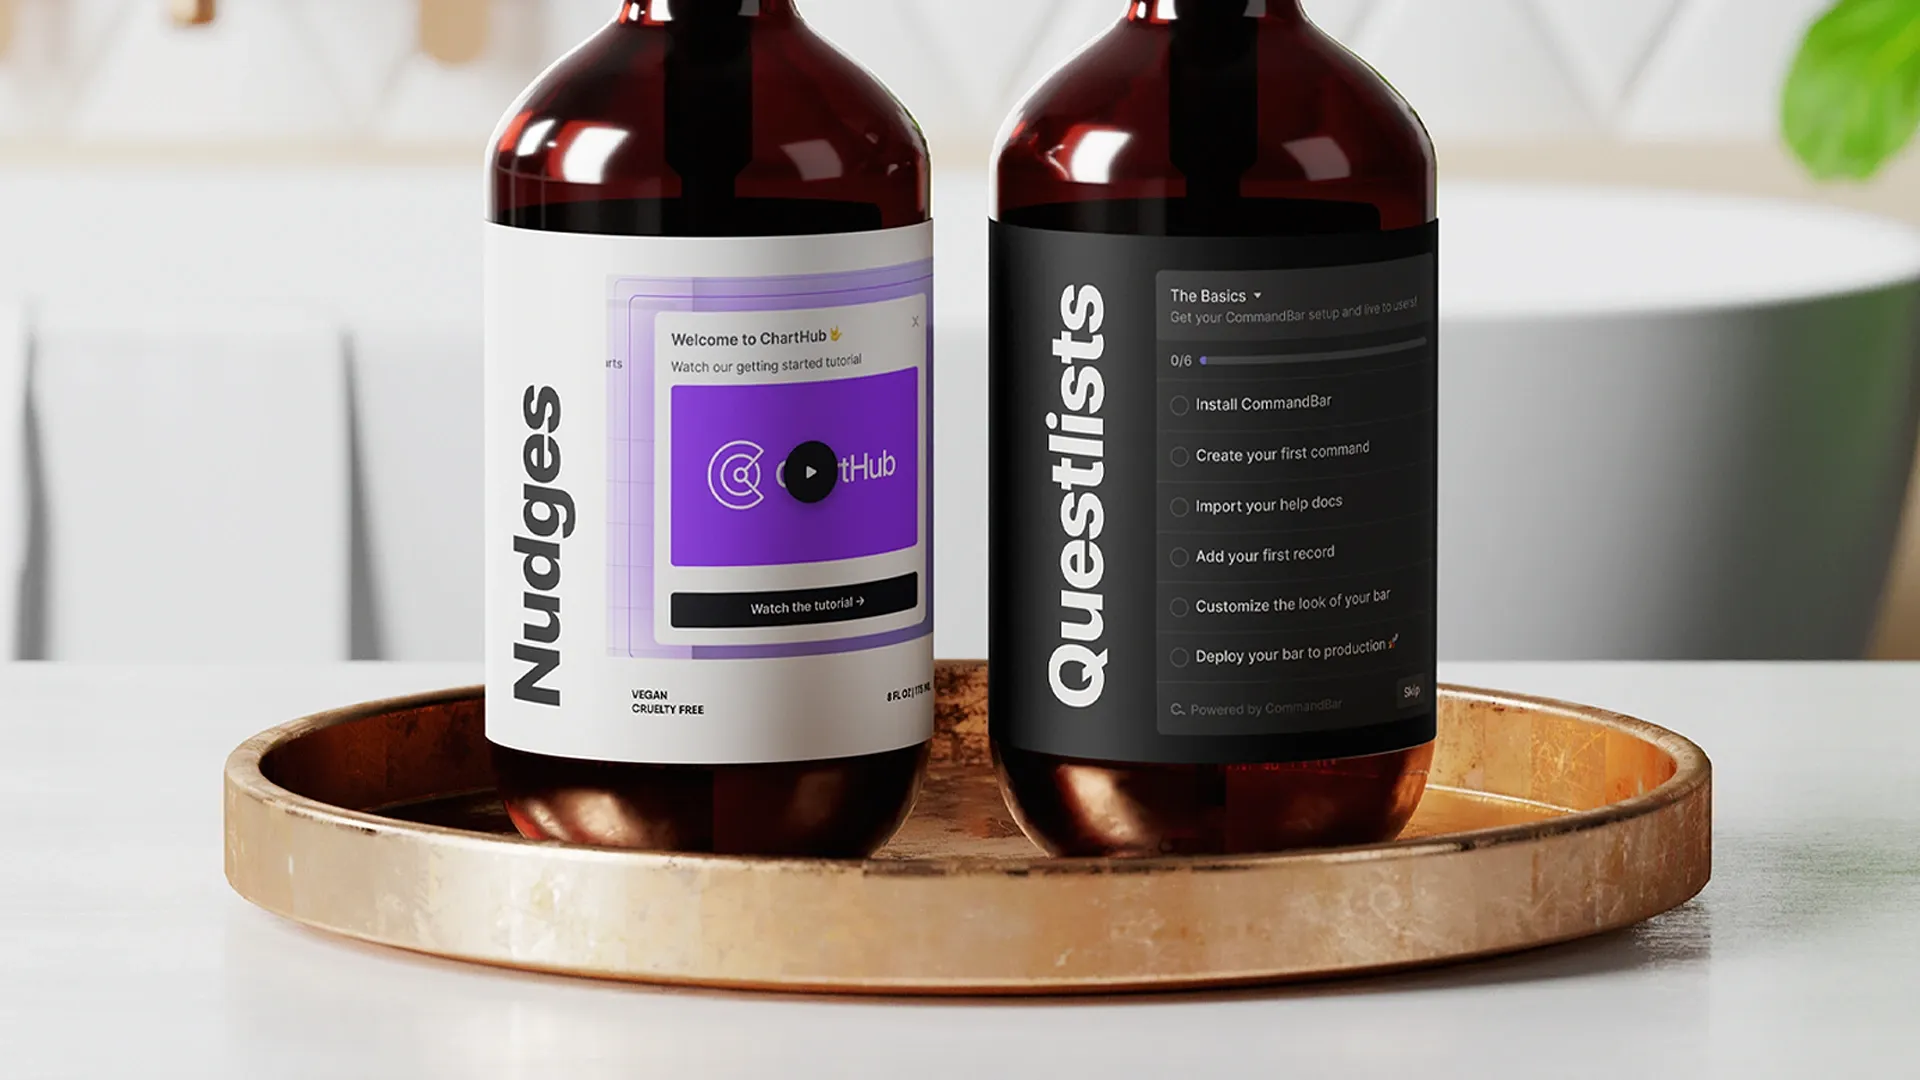
The percent of customers that used the feature during the time period. Feature adoption rate can help your team pinpoint which features need more love and which are succeeding. Sometimes in-app messaging is all it takes to improve feature usage -- your users simply do not know the feature exists or how they should use it. In other cases, core functionality might be missing.
Usage frequency
Usage frequency can be measured on two extremes, as well as everything in between.
- Broadest: How often are users using your product?
- Most specific: For a specific action, e.g., sending a message -- how often are users taking the target action?
You usually want users to engage with your product, so you want to see higher usage frequency. If users interact with a feature often, they are likely getting value from it.
In rare cases, making certain processes more efficient can actually decrease usage frequency while increasing customer satisfaction. For example, users want to complete their taxes in TurboTax as quickly as possible.
Time-to-value (TtV)
Time-to-value measures how long it takes a user to reach one of your product's "aha" moments. For Slack, this is measured as the time it takes a workspace to reach 2000 messages. Decreasing TtV is a surefire way to improve the new user experience and convert new customers. If your TtV is high, consider the following:
- Enhancing your product's in-app messaging strategy with onboarding checklists, contextual tooltips, or announcement modals.
- Productizing "happy paths" (e.g., getting started flows) to make it easier for new users to discover your app's killer feature(s).
Error/bug rate
Of all the metrics, the =error/bug rate is the most technical. The most common ways to measure bug rate are:
- Number of bugs for a product/feature over a period of time
- Percent of actions in a product/feature that result in a bug
- Percent of users that hit a bug over a period of time or across a number of sessions
Understanding how often bugs occur relative to usage can reveal paint points in the customer journey and improve customer loyalty.
2. Customer satisfaction
Net Promoter Score (NPS):
Net promoter score reflects how likely users are to recommend your product to others. A higher NPS indicates that your users are satisfied with your product and are more likely to refer others.
Churn rate / retention rate
Churn and retention are two sides of the same coin. Churn rate is the percentage of users that stop using your product during a given time period. Retention rate is the percentage of users that continue to use your product after a given time period. High churn and low retention are indicators that you should help new users understand your product's value and get them to an aha moment more quickly. Session playback tools can be helpful for digging deeper, e.g., to uncover customer behavior patterns.
Referral rate
A subset of conversion rate, referral rate measures the percentage of users who refer others to your product. A higher rate indicates that users are highly engaged and satisfied.
Viral Coefficient
Viral coefficient measures how many new users each existing user brings in. A higher viral coefficient implies that your product spreads effectively through word-of-mouth and referrals.
3. Financial
Cost per Acquisition (CPA)
This metric measures the cost of acquiring a new customer. The lower the CPA, the more cost-effective your marketing efforts are.
Customer lifetime value (CLTV)
Customer lifetime value measures the revenue you can earn from your average customer over their lifetime. A higher average customer lifetime value means that your customers are deriving more value from your product and generating more revenue for your business.
Monthly recurring revenue (MRR)
MRR is the amount of revenue your product generates every month. MRR goes hand in hand with product growth. While it can be great to see MRR increase, you have to consider the costs that are factored in, like marketing campaigns.
Customer Acquisition Cost (CAC):
Customer acquisition cost is the cost of acquiring a new customer. Low customer acquisition costs mean your customer acquisition efforts are more cost-effective and profitable. Product-led growth (PLG) is a major lever companies are turning to acquire customers at a much lower cost.
Tying a bow
Product metrics are essential for measuring the success of your product and user experiences. By understanding the metrics that matter most for your product or use case, you can make informed, data-driven decisions about improving your product. With the right product management metrics in place, you and your team can prioritize more confidently.