


I guarantee you know this: You want to do something simple, but for some reason, it feels complicated. Even if it doesn't take long, it's annoying. It's fascinating: The feature does its job and does it quickly, and yet the user (you) is annoyed.
Of course, you want to avoid that outcome in your own product. But it's hard to find these spots—after all, you greenlit the designs! So how do you measure it? Enter Customer Effort Score.
Customer effort score is a great metric to understand how your users feel about the ease or difficulty of achieving certain tasks within your product. It's best suited for immediate querying following the completion of a task, so that the feedback is timely and accurate.
Understanding the ease of use of your product, or specific feature sets within your product, is key towards building a great user experience. CES offers a great way to analyze user experiences and identify areas for improvement.
I know, “customer effort score” sounds somewhat boring and vanilla and corporate 😑 But trust me, it can lead to some really amazing product improvements — just read on and you’ll find out why and how!
How customer effort score is measured
The customer effort score metric originated from a very popular Harvard Business review article, which emphasized that gauging the ease of use of your product can be a better metric for loyalty and customer satisfaction than a lot of existing metrics.
The original model proposed a 1 to 5 scale:
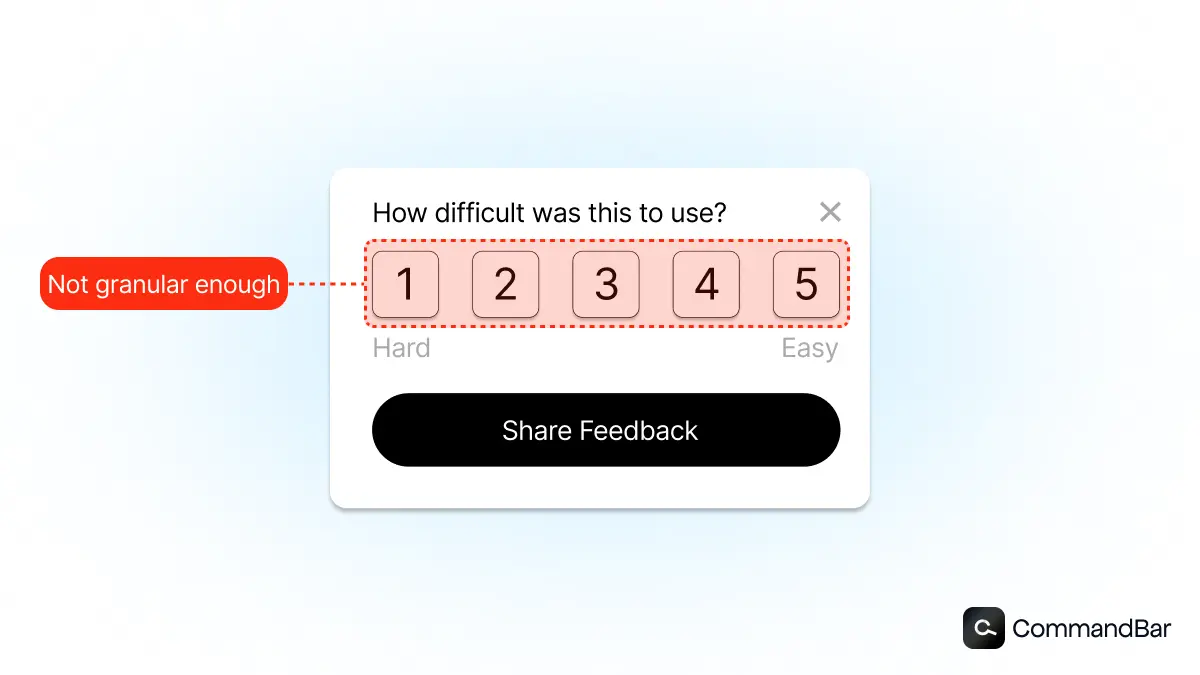
But, that has evolved into a 1 to 7 scale (CES 2.0 FTW) as it offers a better overall structure for gathering highly accurate data. That's because it's large enough to offer distinct choices, but not so large that folks feel they cannot assign a high level score.
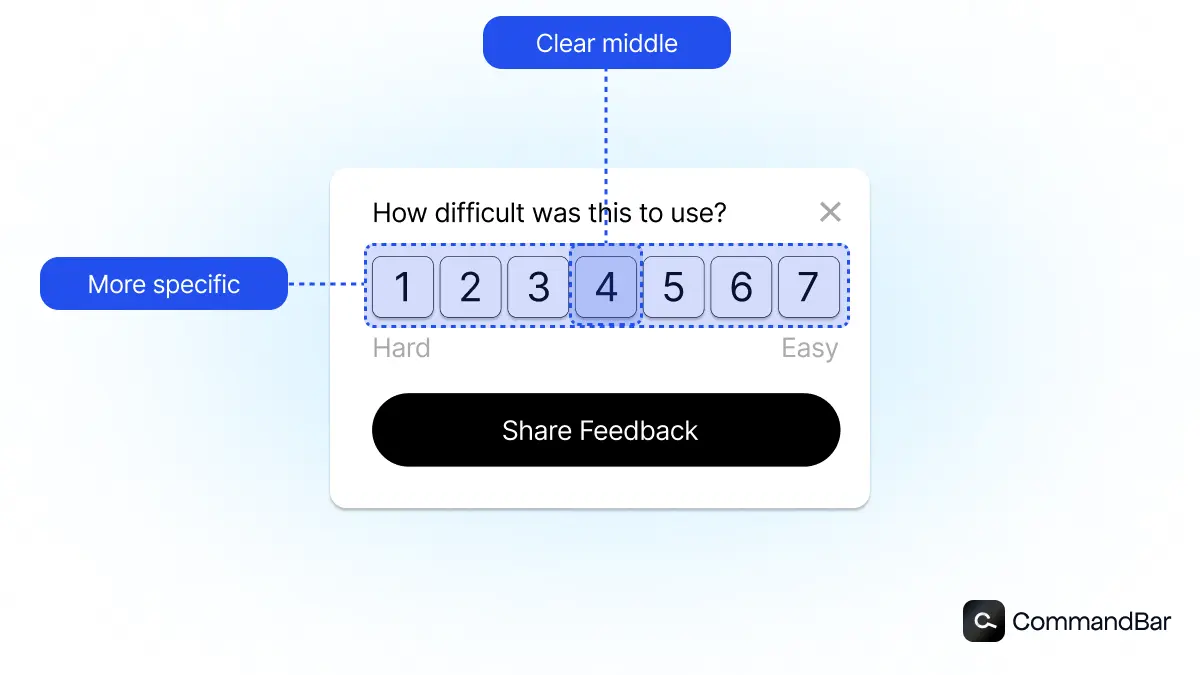
It's also helpful to have a midpoint number in number four, as opposed to a 1 to 5 scale in which a two and a half is not assignable.
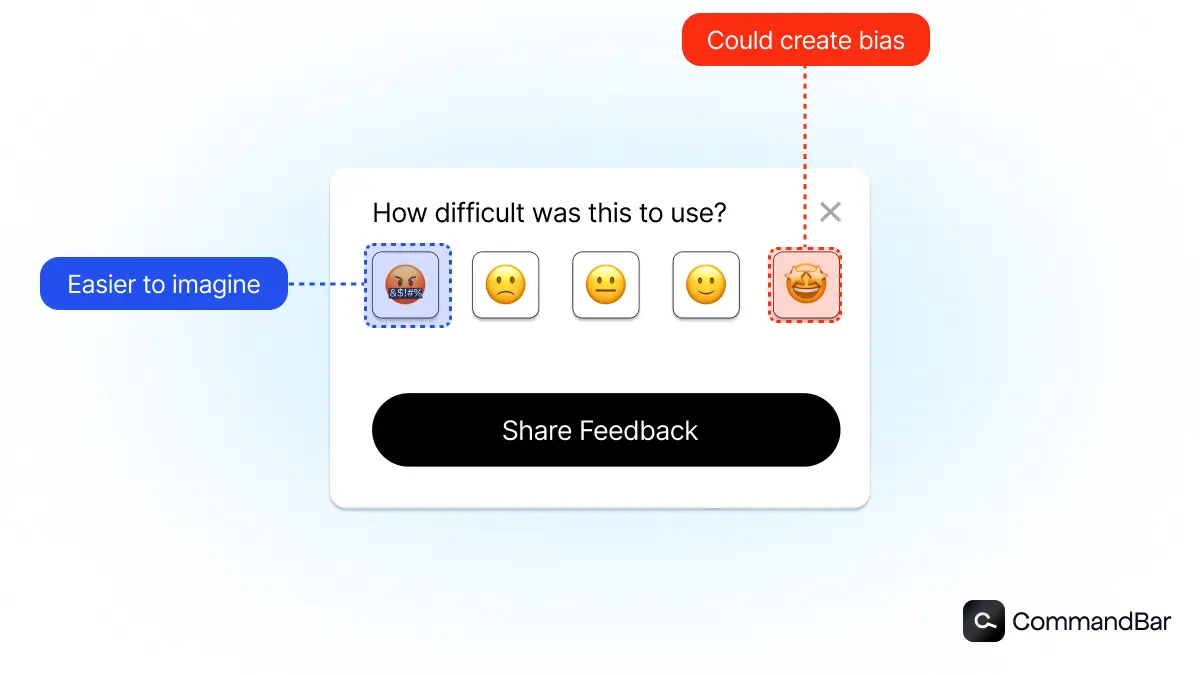
While numeric scoring on the 1-7 scale is popular, you can also have fun with your CES score and use emojis or other ranking systems that you think will resonate with your users.
Calculation
There are two common methodologies for calculating the CES, both of which can give you insight into your overall ease of use.
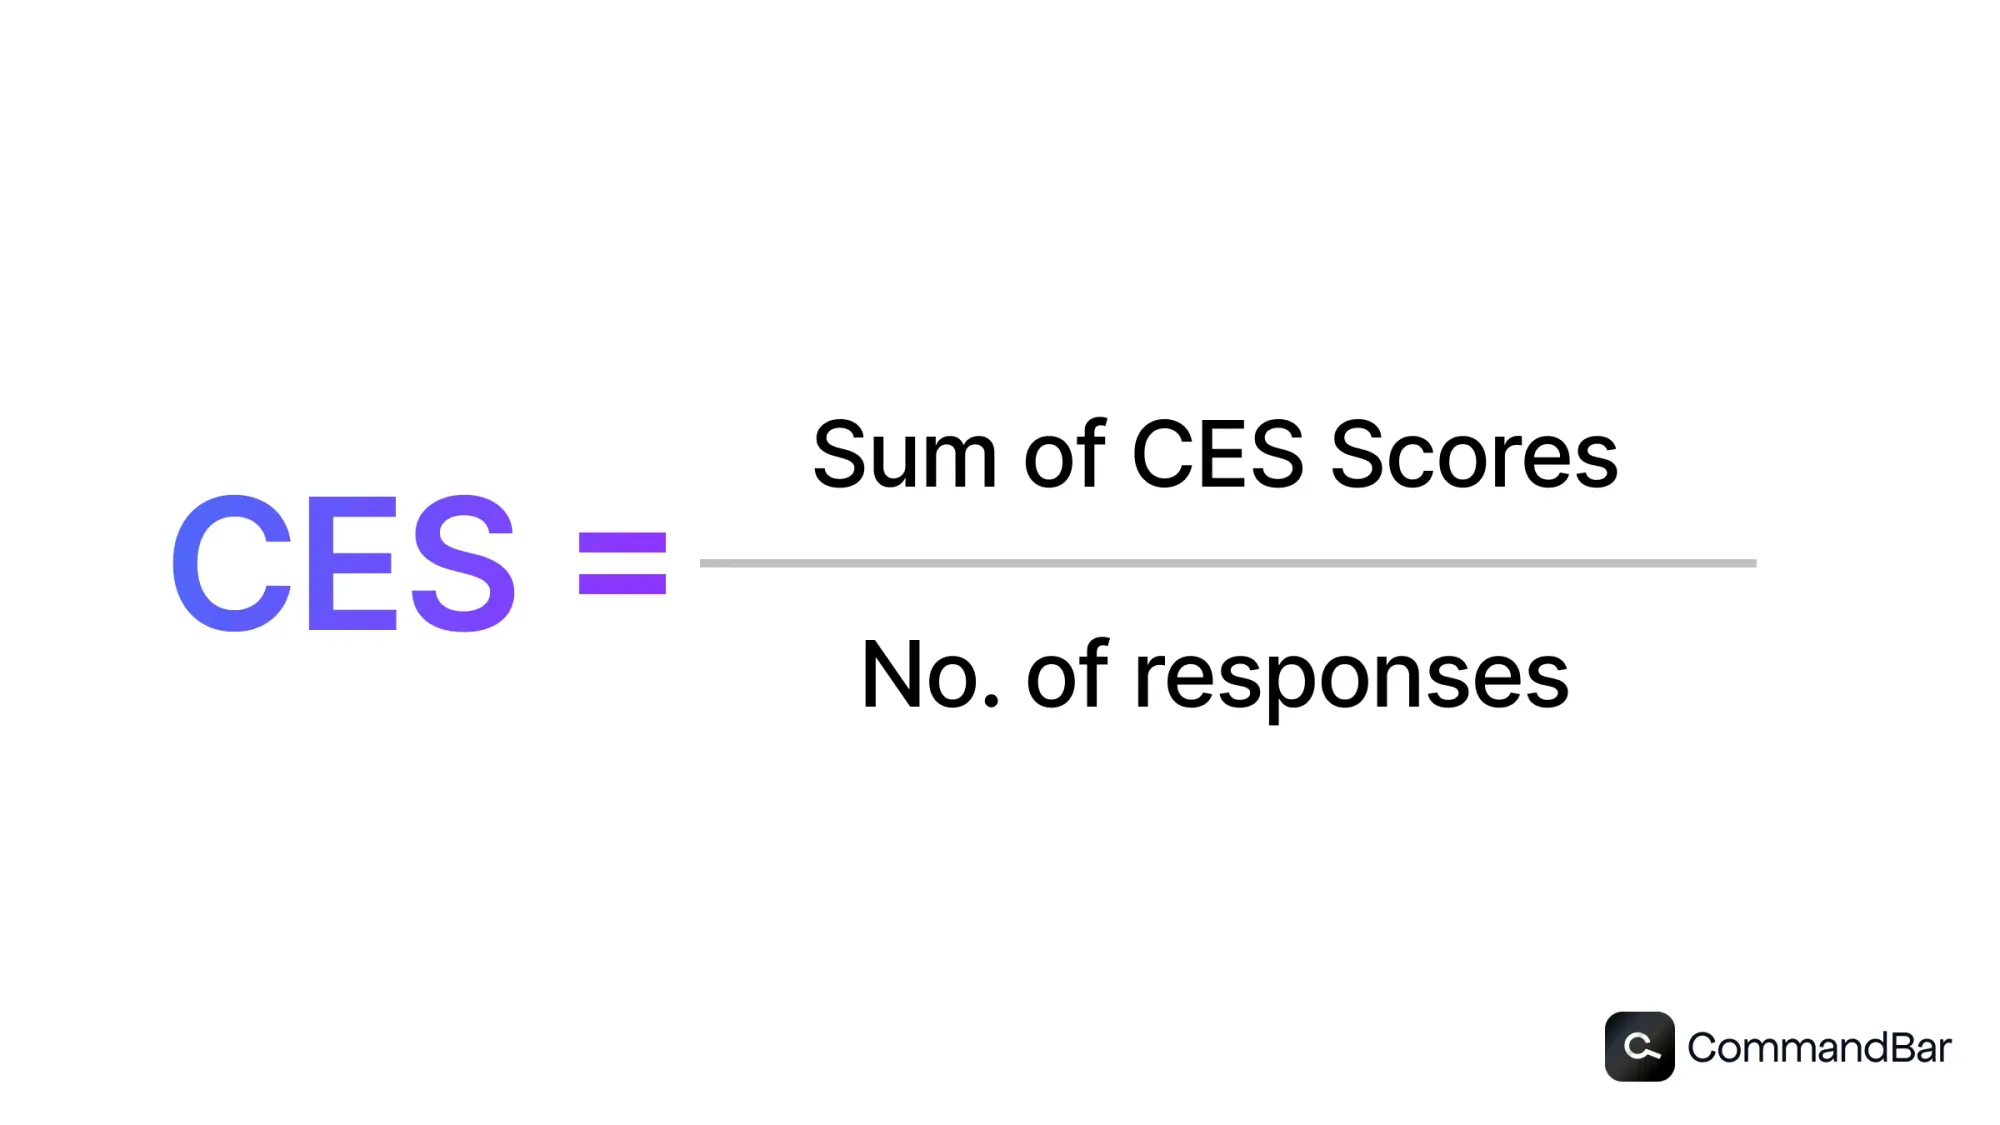
First, you can simply add up all of your scores, divide them by your Mac score which in this case would be seven typically, and you will find your average score. You can then also use other statistical analysis to identify your 25% and 75% quintiles, as well as median score.
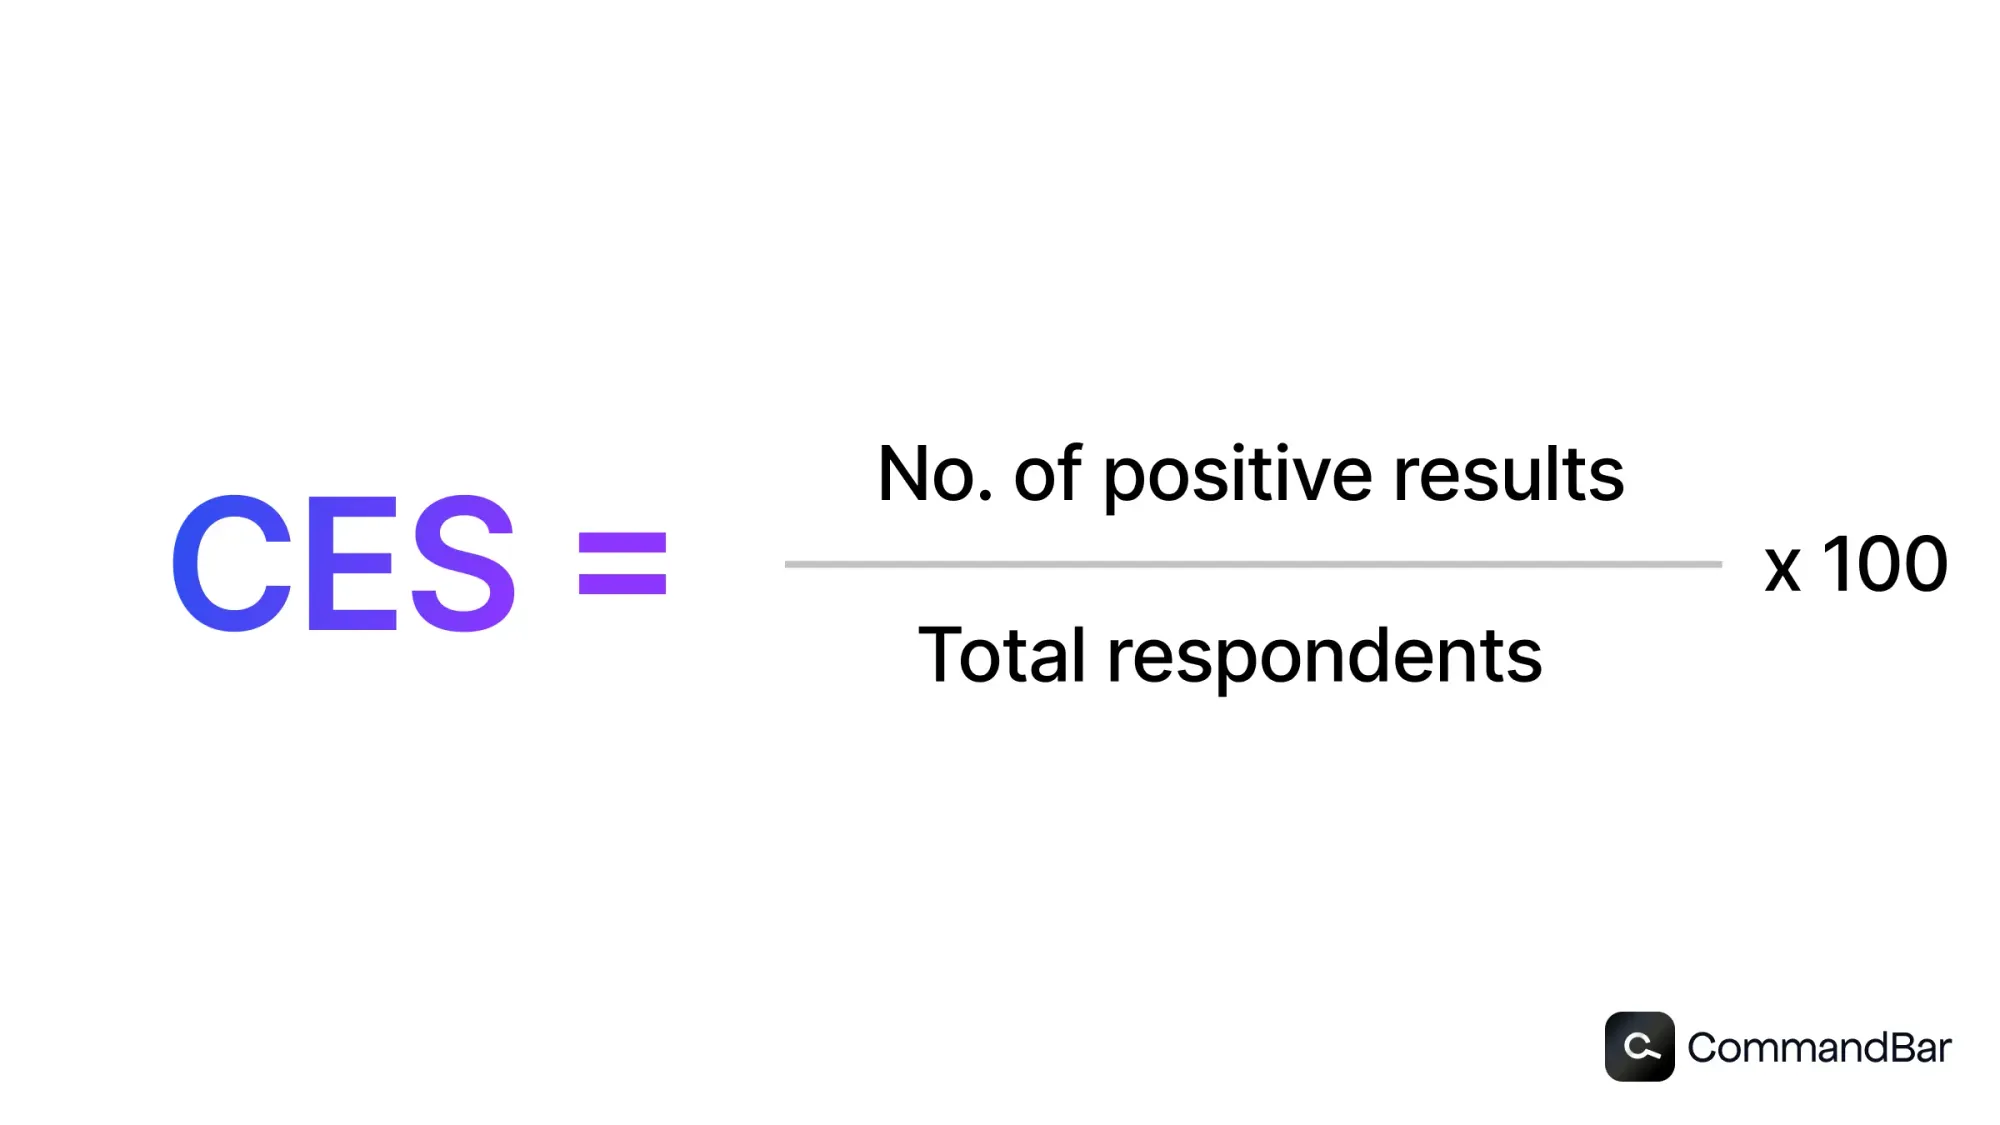
Or, you can set a band of acceptable scores for your team, for example 5+ out of seven, and then calculate the percentage of scores that fall into that range. If you have 100 scores, and 70 of them are fives, sixes, or sevens, you can calculate a 70% success rate.
Both scoring methodologies can provide insight, so it might be helpful to employ both. You can set a goal range and aim for that, while also calculating and tracking the scoring averages.
Segmentation
Segmenting out your CES scores by both user groups and product sections can also be super helpful.
For example, imagine you have three different users for your healthcare platform:
- patients
- healthcare providers
- administrative staff.
All three of these groups use your platform, but they have different objectives and tasks when they log on. Running a single CES survey after the completion of a task is not going to be helpful without proper context and grouping.
A best practice would be to segment out and create separate CES surveys for your different user profiles, and to also segment out those surveys for different areas of your product and specific subtasks within that area.
What’s a good customer effort score? CES benchmark for SaaS
Let's say you're using a typical 1 to 7 scale for your SaaS product CES surveys. You've started to collect data, results are flowing in, and you are analyzing your numbers. Quickly you realize you don't know what a good score is for your industry or niche, or whether failing to hit consistent sevens means you have major issues.
Well the reality is that averages across CES surveys very greatly depending upon:
- The type of task prior to the CES survey
- The industry or vertical that you're in and the nature of the work
- The structure and placement and timing of your CES question
So there's no universal hard and fast rule, but there are some good general ranges to orient around. You should aim for consistent averages over 5 out of 7, with high performers surpassing averages of 6+.
Collecting CES data — keep It short and sweet
Keep your CES surveys short and sweet. They should take no more than 5 seconds for a user to understand and respond to. CES surveys are best suited for transactional experiences, where users are either completing a purchase or request, like a support ticket. They are not designed to give overall product feedback, so make sure you trigger them right after a transactional encounter occurs.
Your goal is to have your user in and out of the flow within 15 seconds or less — the shorter the better.
How build a customer effort score survey that users will actually respond to
We've just talked through some best practices for CES collection, so now let's summarize that for your actual CES survey question creation.
When you're creating your CES survey, you want to do a few core things:
- Frame the ask in a positive way, and demonstrate why they should submit a response
- “Improve Your Experience” or “This Feedback Goes Straight To Our Team” not “Feedback Requested” or “Submit Your Response Now”
- Keep it short and sweet — use a 1 to 7 scaled or a ranking system of your choice
- Know your audience and what will resonate with them
- Add optional spaces for extra qualitative feedback — as a bonus, use conditional. logic so the extra questions only trigger on specific ranking responses (negative scores, non-perfect scores, etc.)
- “What could we be doing better” or “what’s the first thing you’d want us to improve” or “if you could change one thing to improve your experience, what would it be” are all great framings.
- Avoid blank or required text spaces as they may discourage users from submitting any response at all if your form looks too time consuming. A safe bet is to assume your user's attention span is 20% as long as you think it is, and to orient around serving that length.
Let’s take a look at a couple examples of CES survey questions:
Healthcare insurance company — Grade: B-
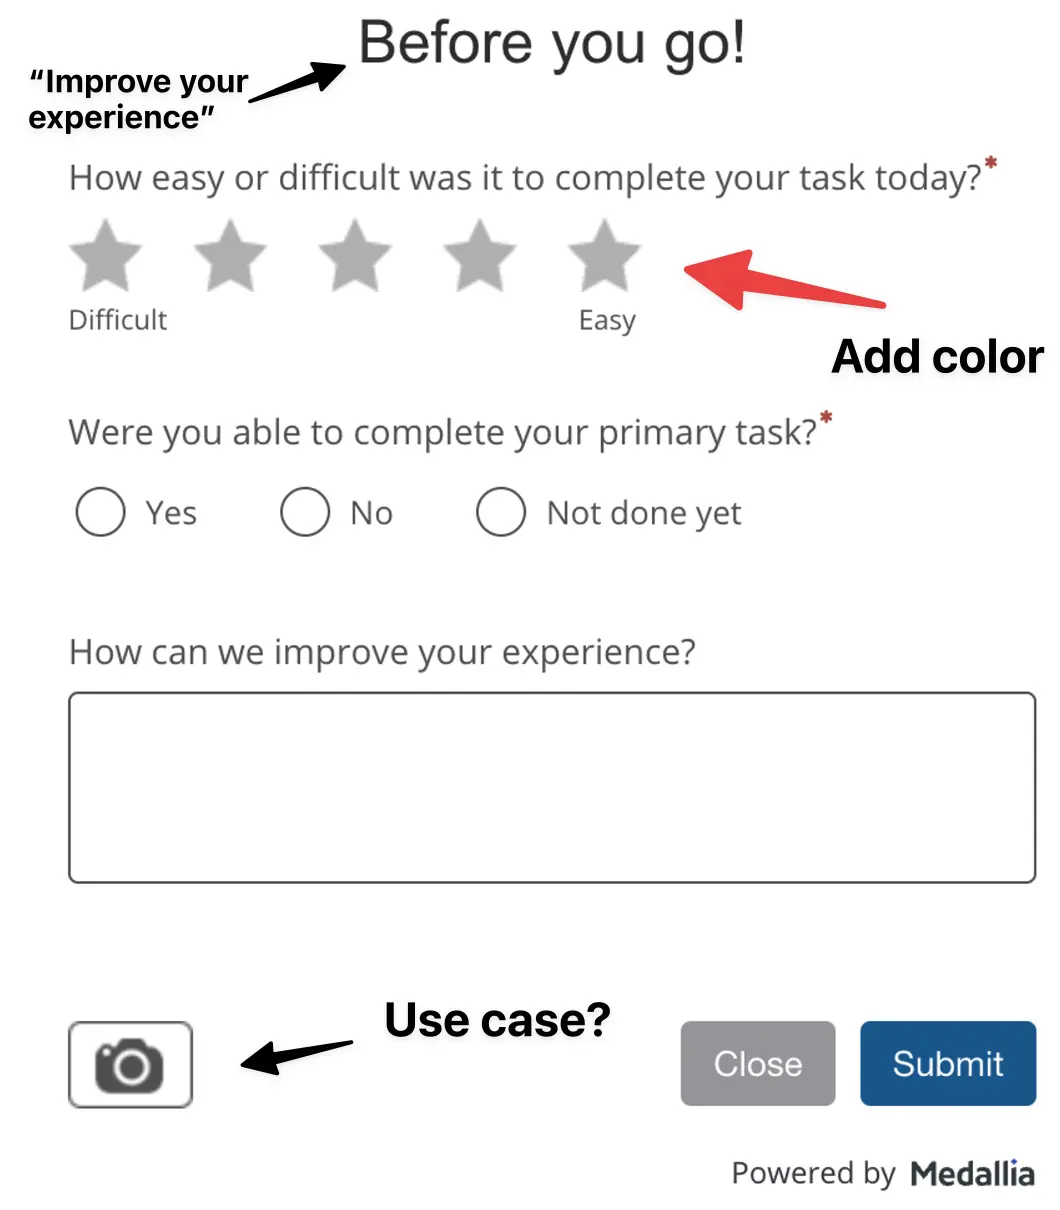
This is a partially optimized CES survey from my healthcare insurance provider. It asks two additional questions for further context. This could be improved by expanding the the scoring range and by improving the “Before You Go” header to something that relates to why they should complete it, like “Improve Your Experience!” Plus, there’s an ambiguous camera icon (media attachement, something else?) and the scoring system is not color delineated. It’s mediocre at best, so I’m giving it a B-. Either way, unfortunately for them, I did not have a good experience on their platform submitting insurance claims (surprise, surprise!)
Nicereply - A-
Nicereply offers feedback collection software for other software businesses. They've designed a very - which uses a 7-point scale as well as color coding with bolded question text to make it easy for users to quickly understand the question and respond.
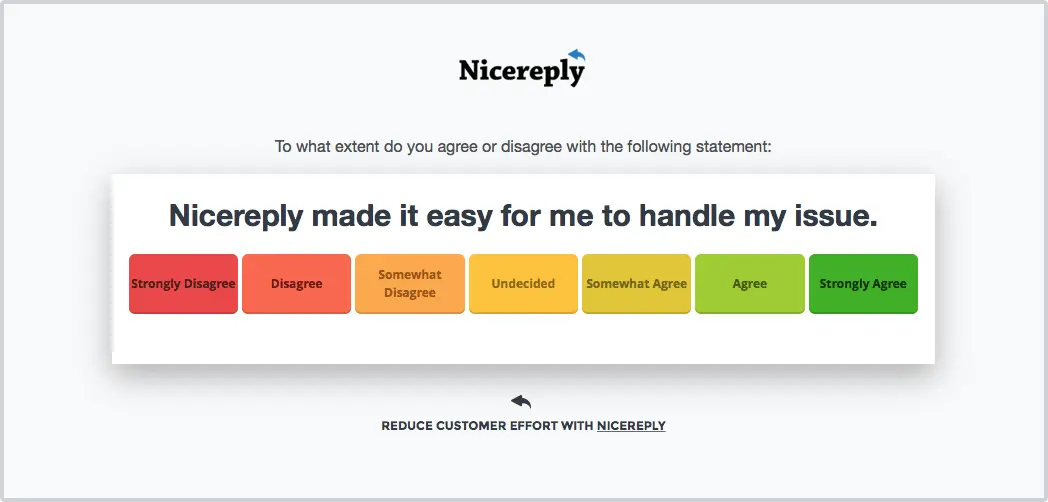
This is a great example of a quick and easy and well-designed CES survey. The only reason it didn't get full marks is because the text is a little hard to read and their sizing could be improved.
How to turn customer effort scores into meaningful product improvements
Now that you've set up your CES questionnaire and understand the best practices, it's important to understand how you can effectively and quickly improve your software through analysis of CES data and implementation of solutions. When you analyze your CES data, you can break out the segments as we discussed and then look for areas where you are consistently scoring below.
Once you’ve found the areas primed for improvement, you can use a user assistance tool like CommandBar to quickly implement fixes. Let’s run through a couple examples of how you can leverage CES insights to drive improved user experiences without much lift.
Onboarding woes
Issue: Your CES scores are lower than you would like for users setting up their profile during their first session. Feedback points to friction and a misunderstanding the required steps and order of completion.
Solution: You hop onto the CommandBar platform and quickly set up a product tour that guides your users through the steps they need to complete to fully set up their profile and get going. When new users log on, they appreciate the light but instructive guiding hand through setup.
Brutally slow chat support
Issue: Customers are consistently ranking your chat support experience as very poor, often with one, two or, three out of seven ratings. They're frustrated with the time it takes to get in touch with an agent.
Solution: You implement CommandBar's AI Copilot, which automatically intakes all of your help documentation and resources, and then provide smart conversation and problem solving for your users. Not only do you improve your user experience with reduced time to answer, you also save on your support agent costs
Increasing referrals
Issue: Your users want to refer their friends and colleagues to your platform, but they're having trouble finding the referral flow. They expressed frustration at having to click through three different layers of account settings to get to the referral page, and consequently have been giving you poor CES scores.
Solution: Your team can't dedicate a standalone space on the dashboard for a referral, but you move it up one layer so it's only one click away, and then you use CommandBar to add a very small nudge towards the page with a text like “Refer your friends here!”
These are just a few examples of common areas where users struggle and give companies poor CES feedback. CommandBar offers a variety of ways to quickly correct these issues without sucking up tons of dev hours.
Conclusion
Collecting CES scores well is both an art and a science, but if you keep things to the point and give your users clear options and a straightforward question, your data should be pretty reliable. But what's most important is making sure that you turn those insights into real product improvements through user assistance tools. Don't get caught passively collecting and forgetting data. Make sure that the time your users took to fill out the survey definitively leads to better experiences for them!