


Every product manager eventually has a quarter where "adoption" is on the roadmap. In a meeting, you see that some features aren't getting as much usage as they could. What do you do about it?
You have what you need on paper, but when it’s time to take action, you’re in a daze…
You’re like, “Heck ya, let’s 10x results,” but when you see a list of random rates and formulas, you’re rescheduling the plan.
Still, SaaS adoption metrics are worth the effort and can transform the future of your platform. You can learn to understand customer behavior and improve user experience and retention.
Beyond the jargon: Understanding adoption metrics
Metrics don’t have to be so difficult. Each adoption metric is a signpost that helps you understand your customer behavior.
It’s like finding clues and solving the mystery to improve your customer experience.
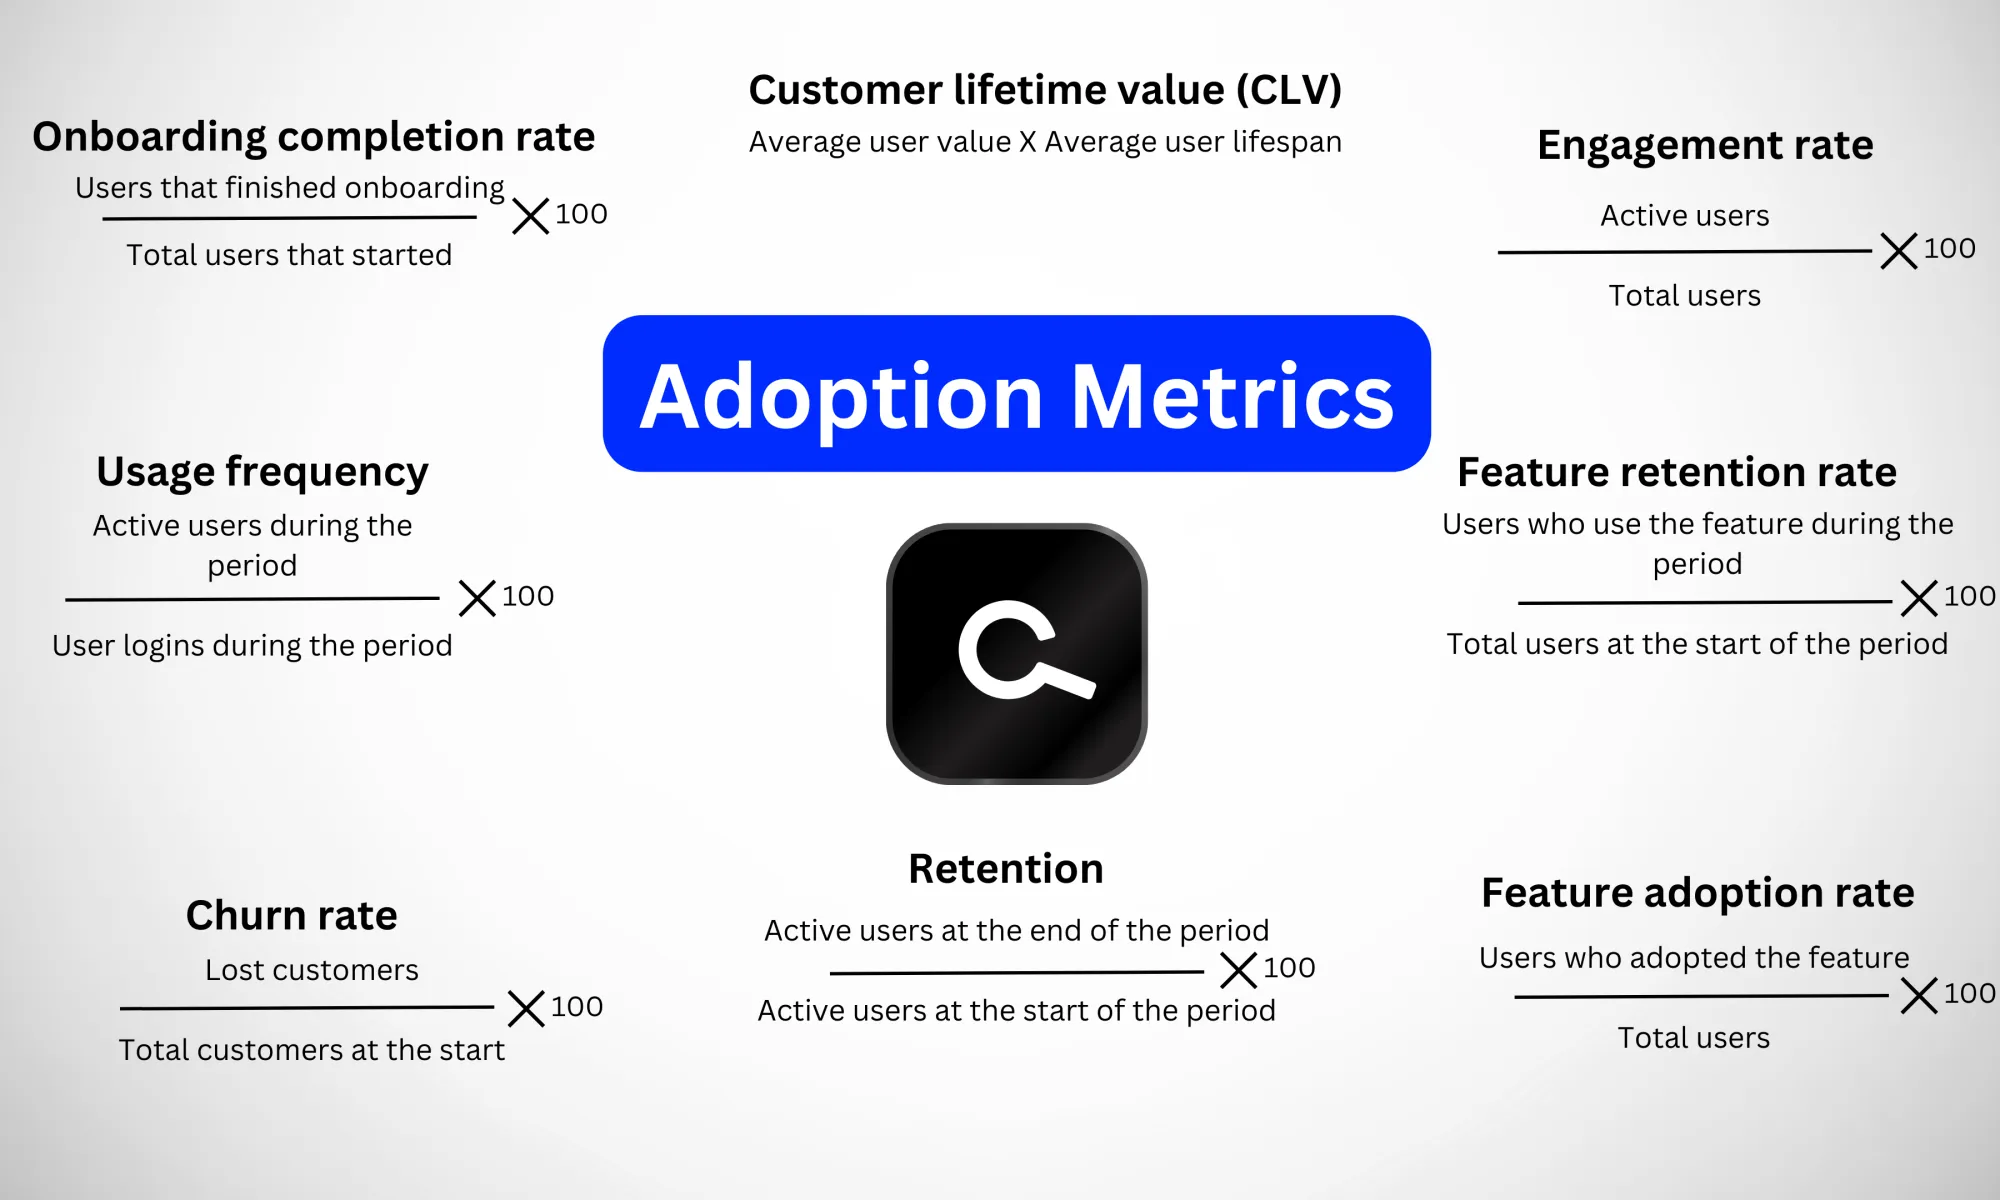
Adoption metrics are a set of analytics focused on evaluating customer adoption. They help you identify current issues, predict trends, and improve your platform.
So, Sherlock, let’s start by viewing adoption metrics through the customer journey lens.
Following the user journey: Navigating the data like a train conductor
Putting product adoption metrics into the context of the customer journey is crucial to better understand their experience and the most impactful improvements we can make.
We want to follow the customer on their train ride. Each metric tells a story.
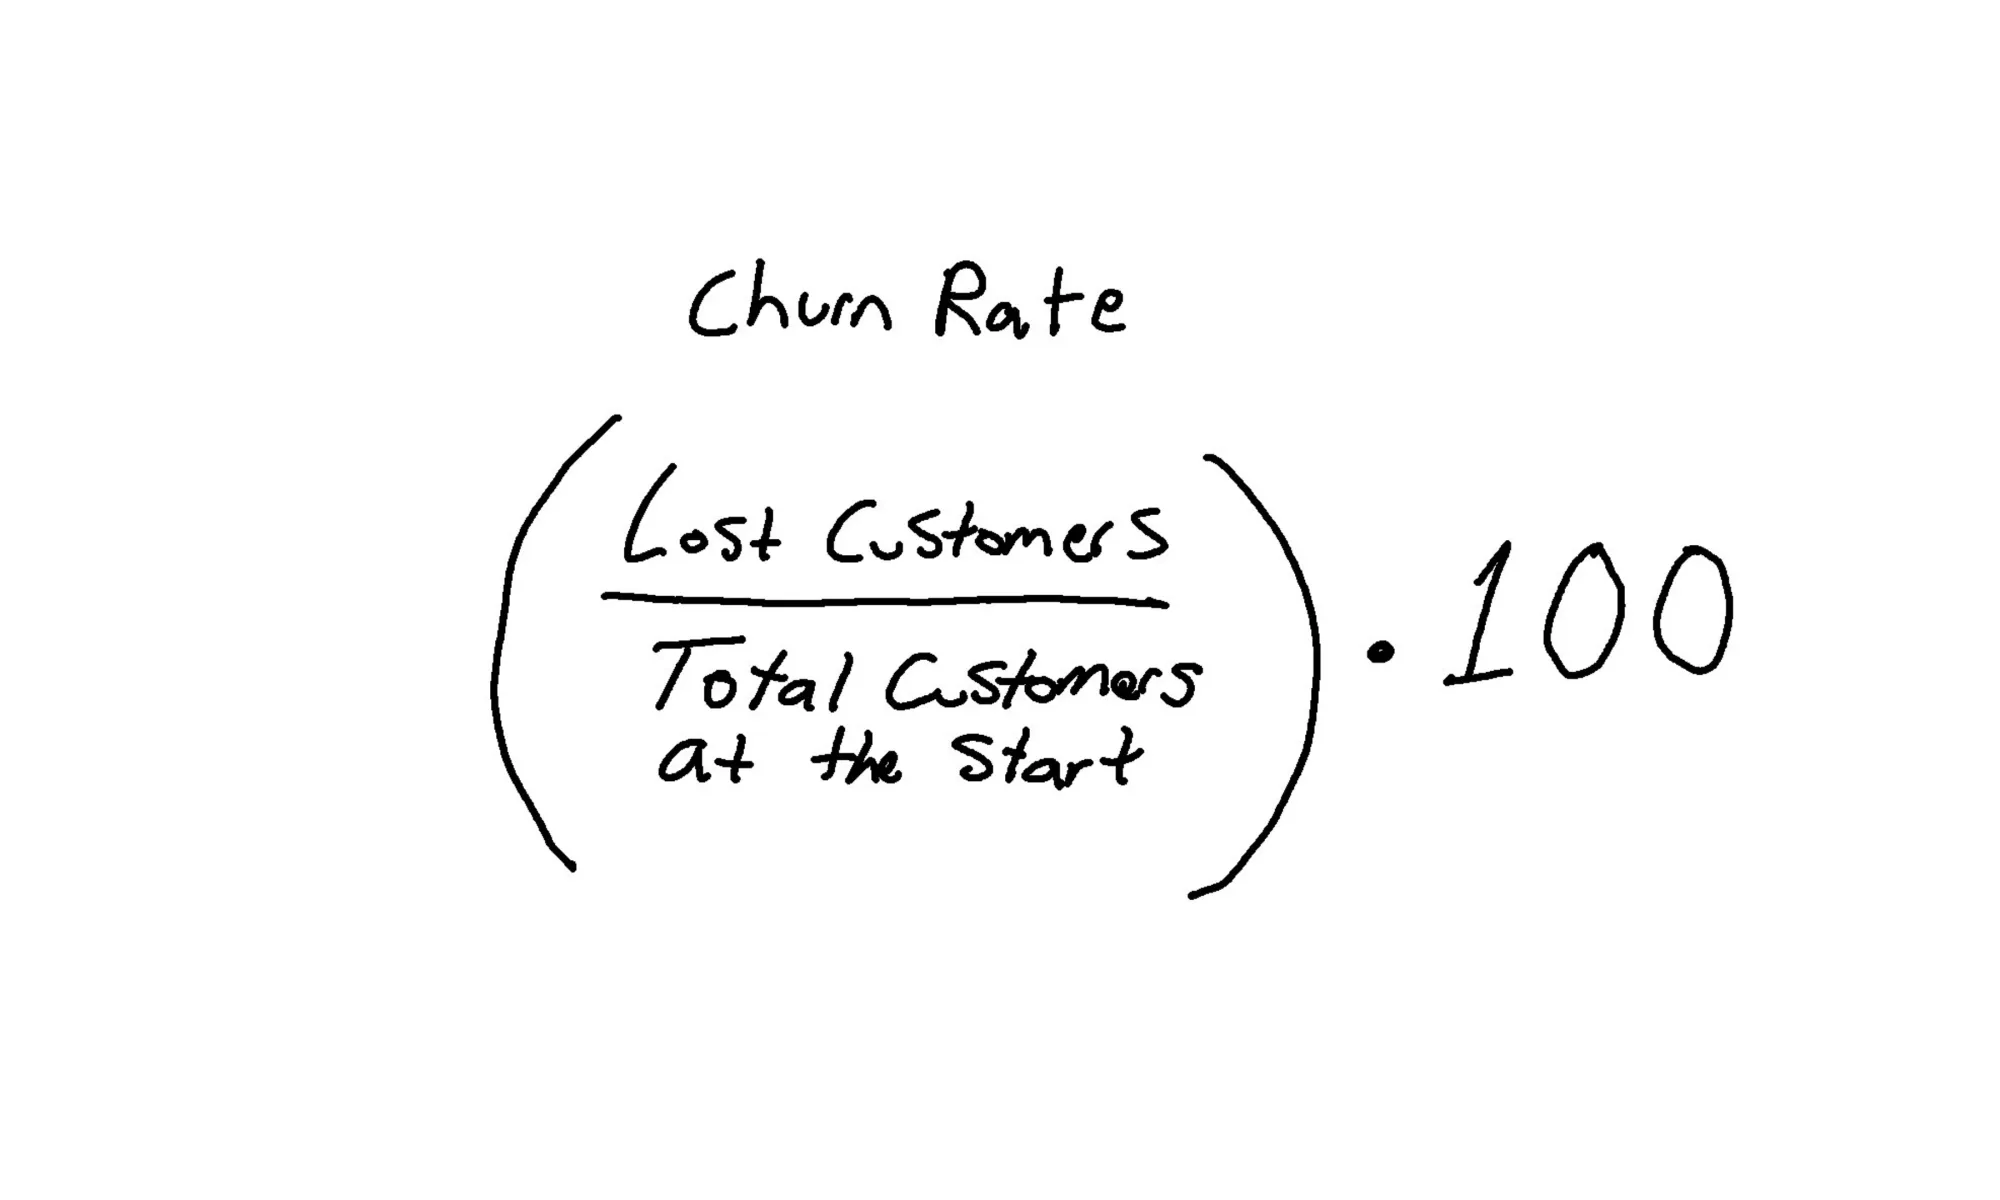
1. Churn rate
The churn rate is the most essential SaaS adoption metric for any business. You cannot keep building a recurring revenue base if this number is high. You might be good at sales, but the product isn’t creating enough value to keep customers.
It reminds me of a lecture from an economics professor presenting the foundation for successful consulting. When you walk into a failing establishment, everything looks like it’s falling apart. You’re tempted to try to fix it all at once or choose the one you think might help the most. But like a human body, there’s an artery—and it’s bleeding—likely causing most of the symptoms. If you don’t fix that issue first, you lose any chance to turn things around.
Churn rates help illuminate the bottom-line health of your SaaS. Do customers like your product, and are they continuing to pay for it, or are they leaving?
Now to the math: The churn rate calculates how many users stopped using your platform since your starting period.
Churn rates are handy because of the adage, “Once you know, you know.” When you’ve identified where you stand, you can begin to investigate.
SaaS businesses can reach out to users who’ve left and ask why. The platform can improve the experience and product to lower churn. Over time, companies can measure how effective their adjustments were.
2. User retention rate
While retention might not reveal everything (like the conditions causing long-term churn), it’s an excellent metric for short-term revenue forecasting.
Churn visualizes users abandoning the wobbling train that’s about to derail. The retention rate helps understand who is still along for the ride. In other words:
- Churn = who stopped using your solution
- Retention = who’s still using it
The user retention rate then follows:
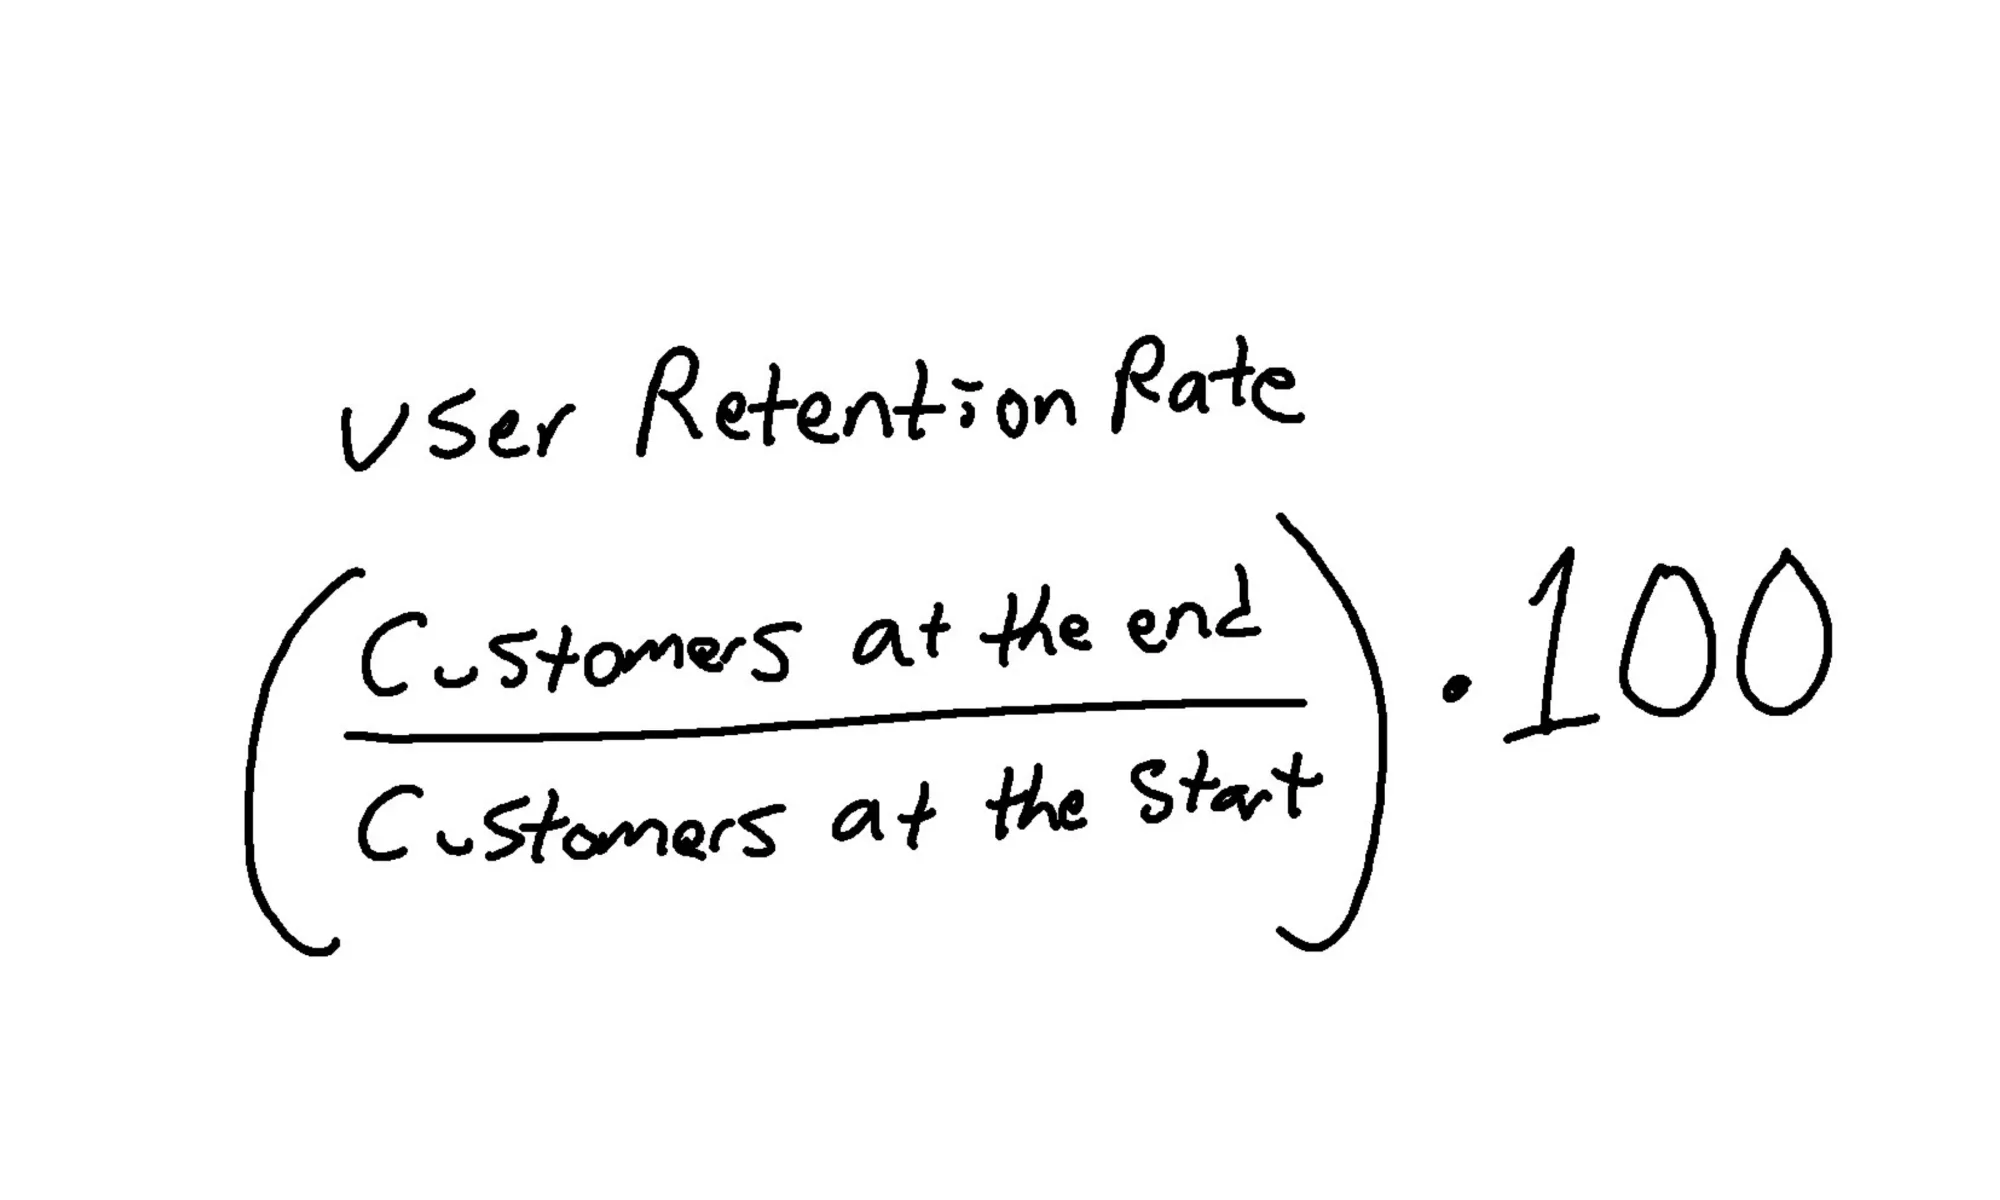
One example of using your retention rate is by analyzing a monthly period. How many paying customers did you have initially vs. at the end? This will help assess your platform’s health and identify issues quickly while you still have time.
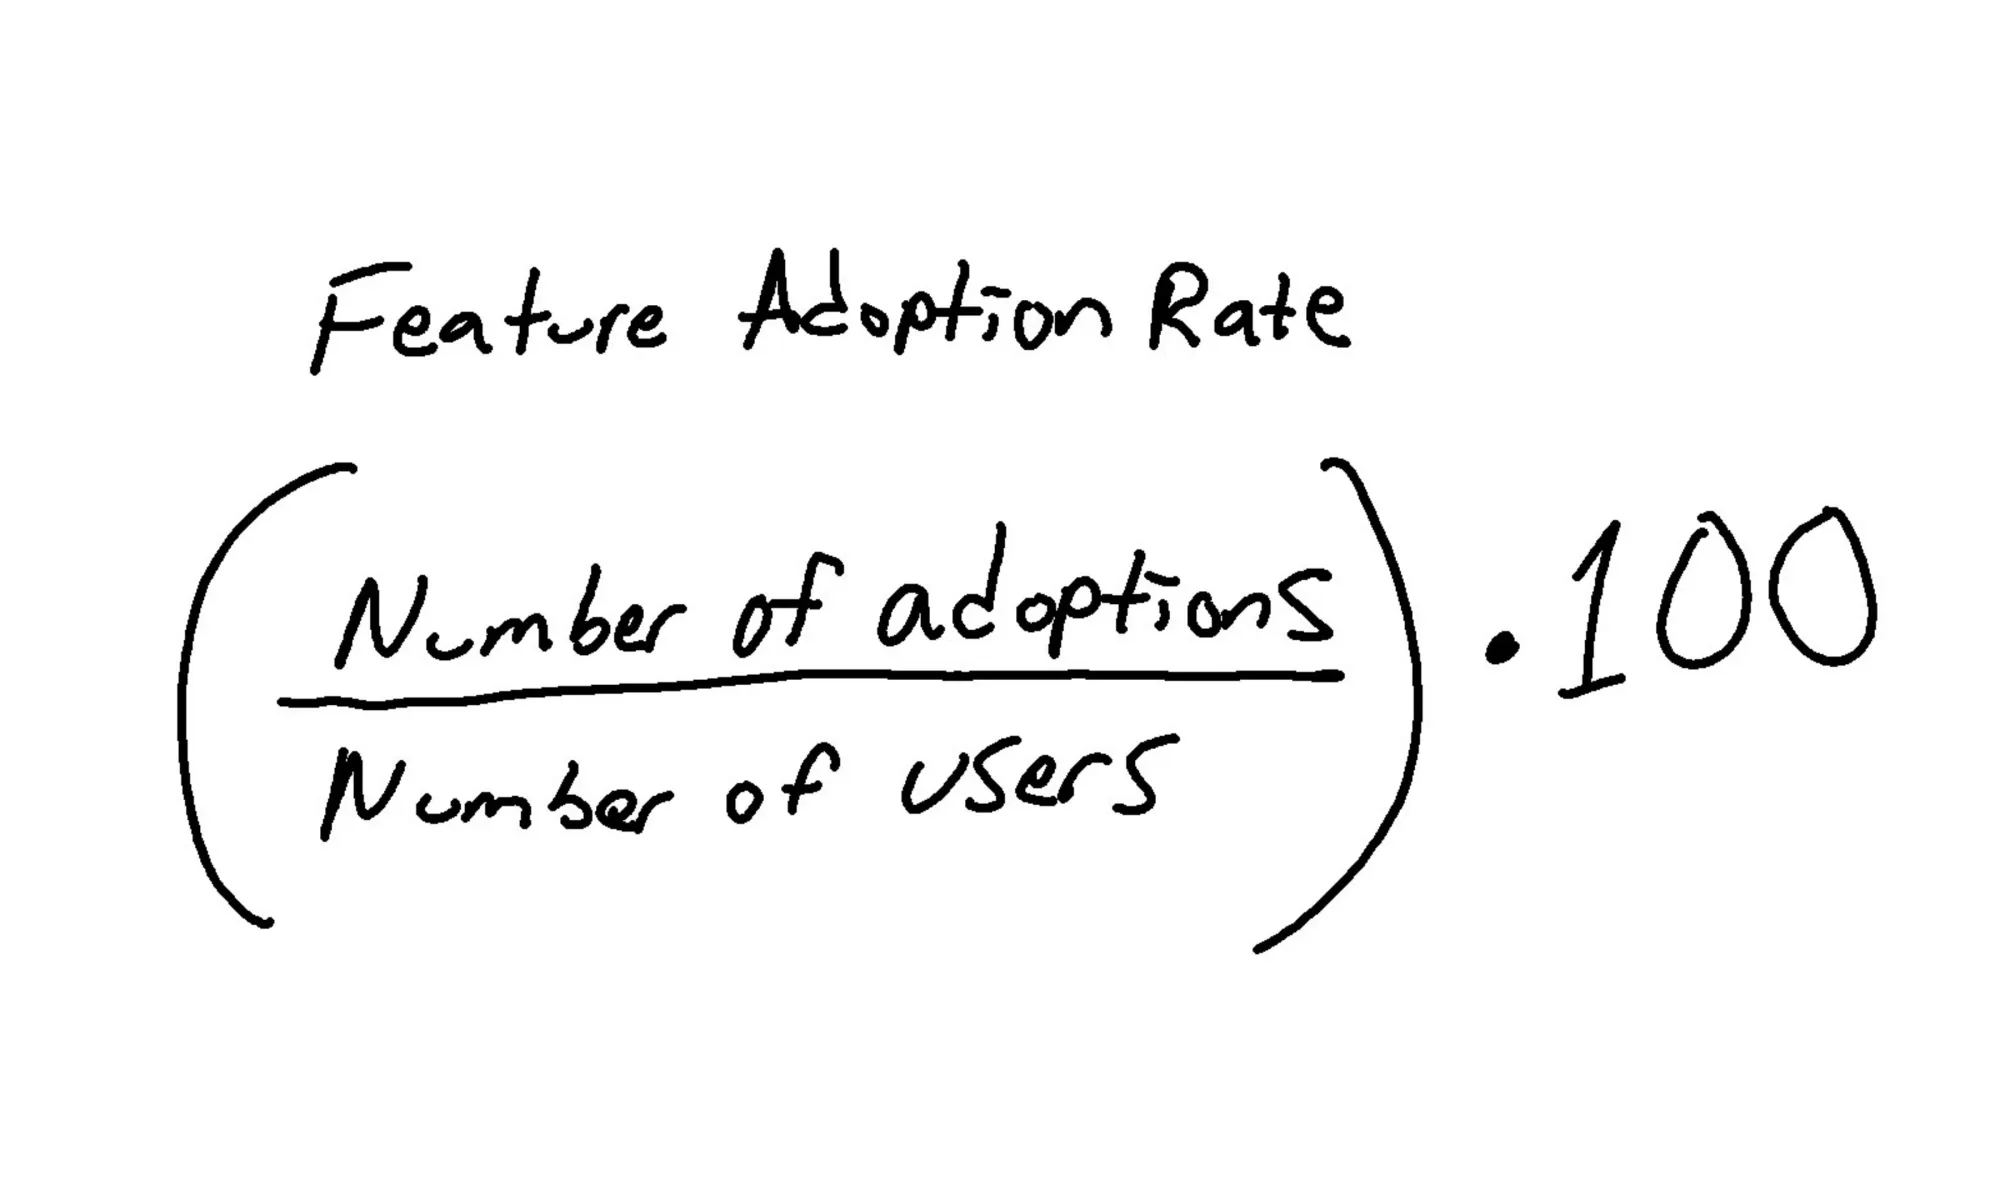
3. Feature adoption rate (and feature retention)
Feature adoption rates are great for testing new features, upgrades, and similar SaaS experiments. But they also tell you valuable information about the features users already use.
For example, you can segment personas based on features.
If your B2B SaaS helps medium-sized and enterprise companies, you can see which features different demographics prefer (and how they use them). It can inform how you improve your features, adoption strategy, and plan for growth based on diverse audiences.
Both feature adoption and retention rates can help you tell a story about customer behaviors.
The feature adoption rate calculates how many users are using that particular feature.
The formula looks like this:
After a specific period, you can analyze if users are still using the new feature (feature retention rate). You can do that by implementing the following formula:
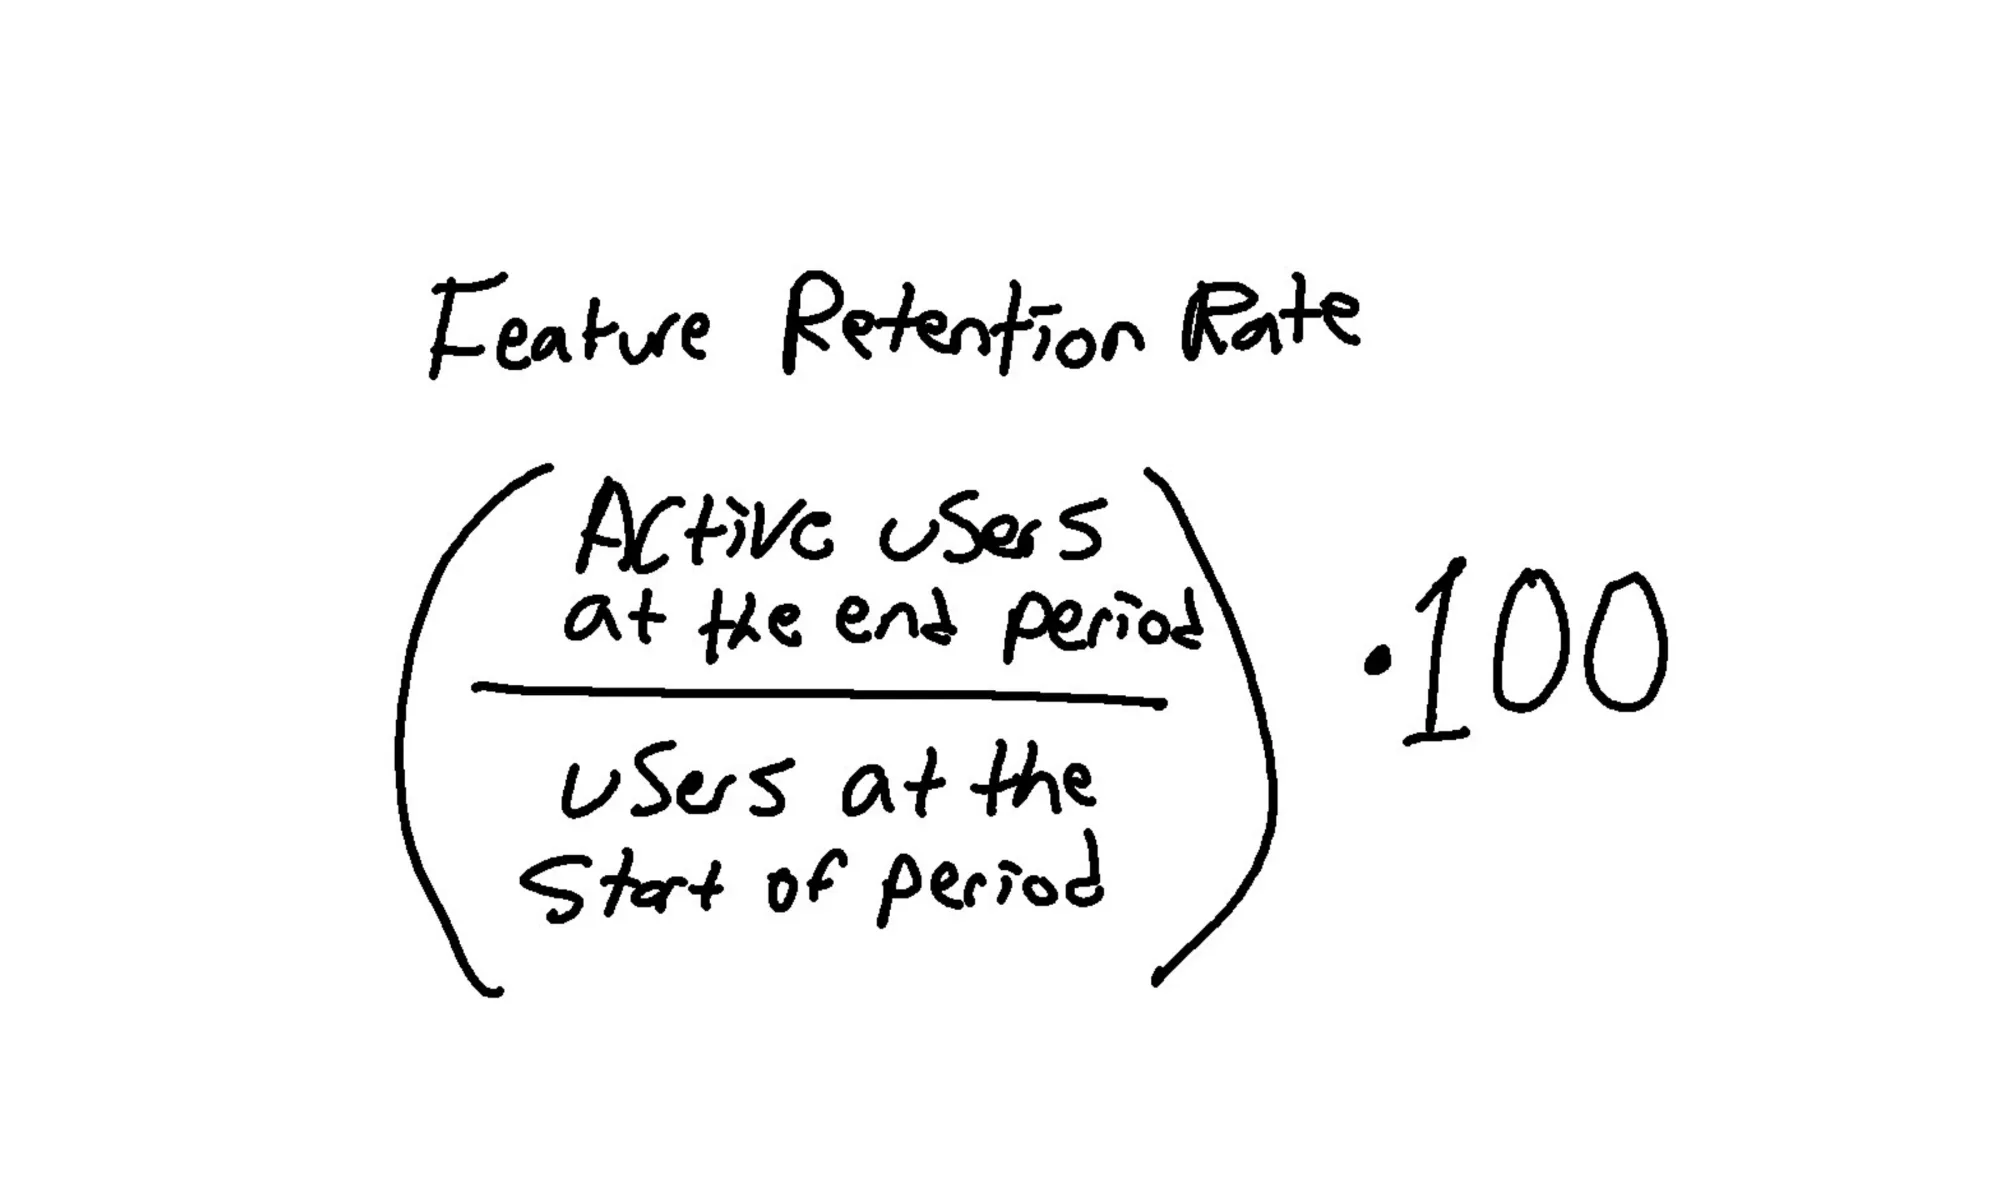
For example, imagine if a platform wants to evaluate a particular feature launched six months ago. The company knows that it can’t maintain the best experience if the platform is weighed down with features. So it wants to provide the top version of the most popular features to stand out in the market.
The company will measure the adoption and retention rate to evaluate whether each new feature is worth investing in and maintaining.
4. Engagement rate and usage frequency rate
The engagement rate measures user behavior trends with your key features. Are customers using them consistently?
Engagement rates can vary (and are sometimes abstract) depending on what you want to measure. Another way to calculate the rate is by analyzing how often they interact with you through in-app feedback, learning resources, and community initiatives.
While it may sound like engagement rates can encompass many factors, it’s primarily gauging two in particular: the loyalty and satisfaction of the customer.
Customers are more likely to become long-term customers and enjoy the app if engaged.
The engagement rate can be calculated by monthly active users using your core features divided by the number of total monthly users. (Or any period you choose.) Then, you multiply by 100 for a percentage.
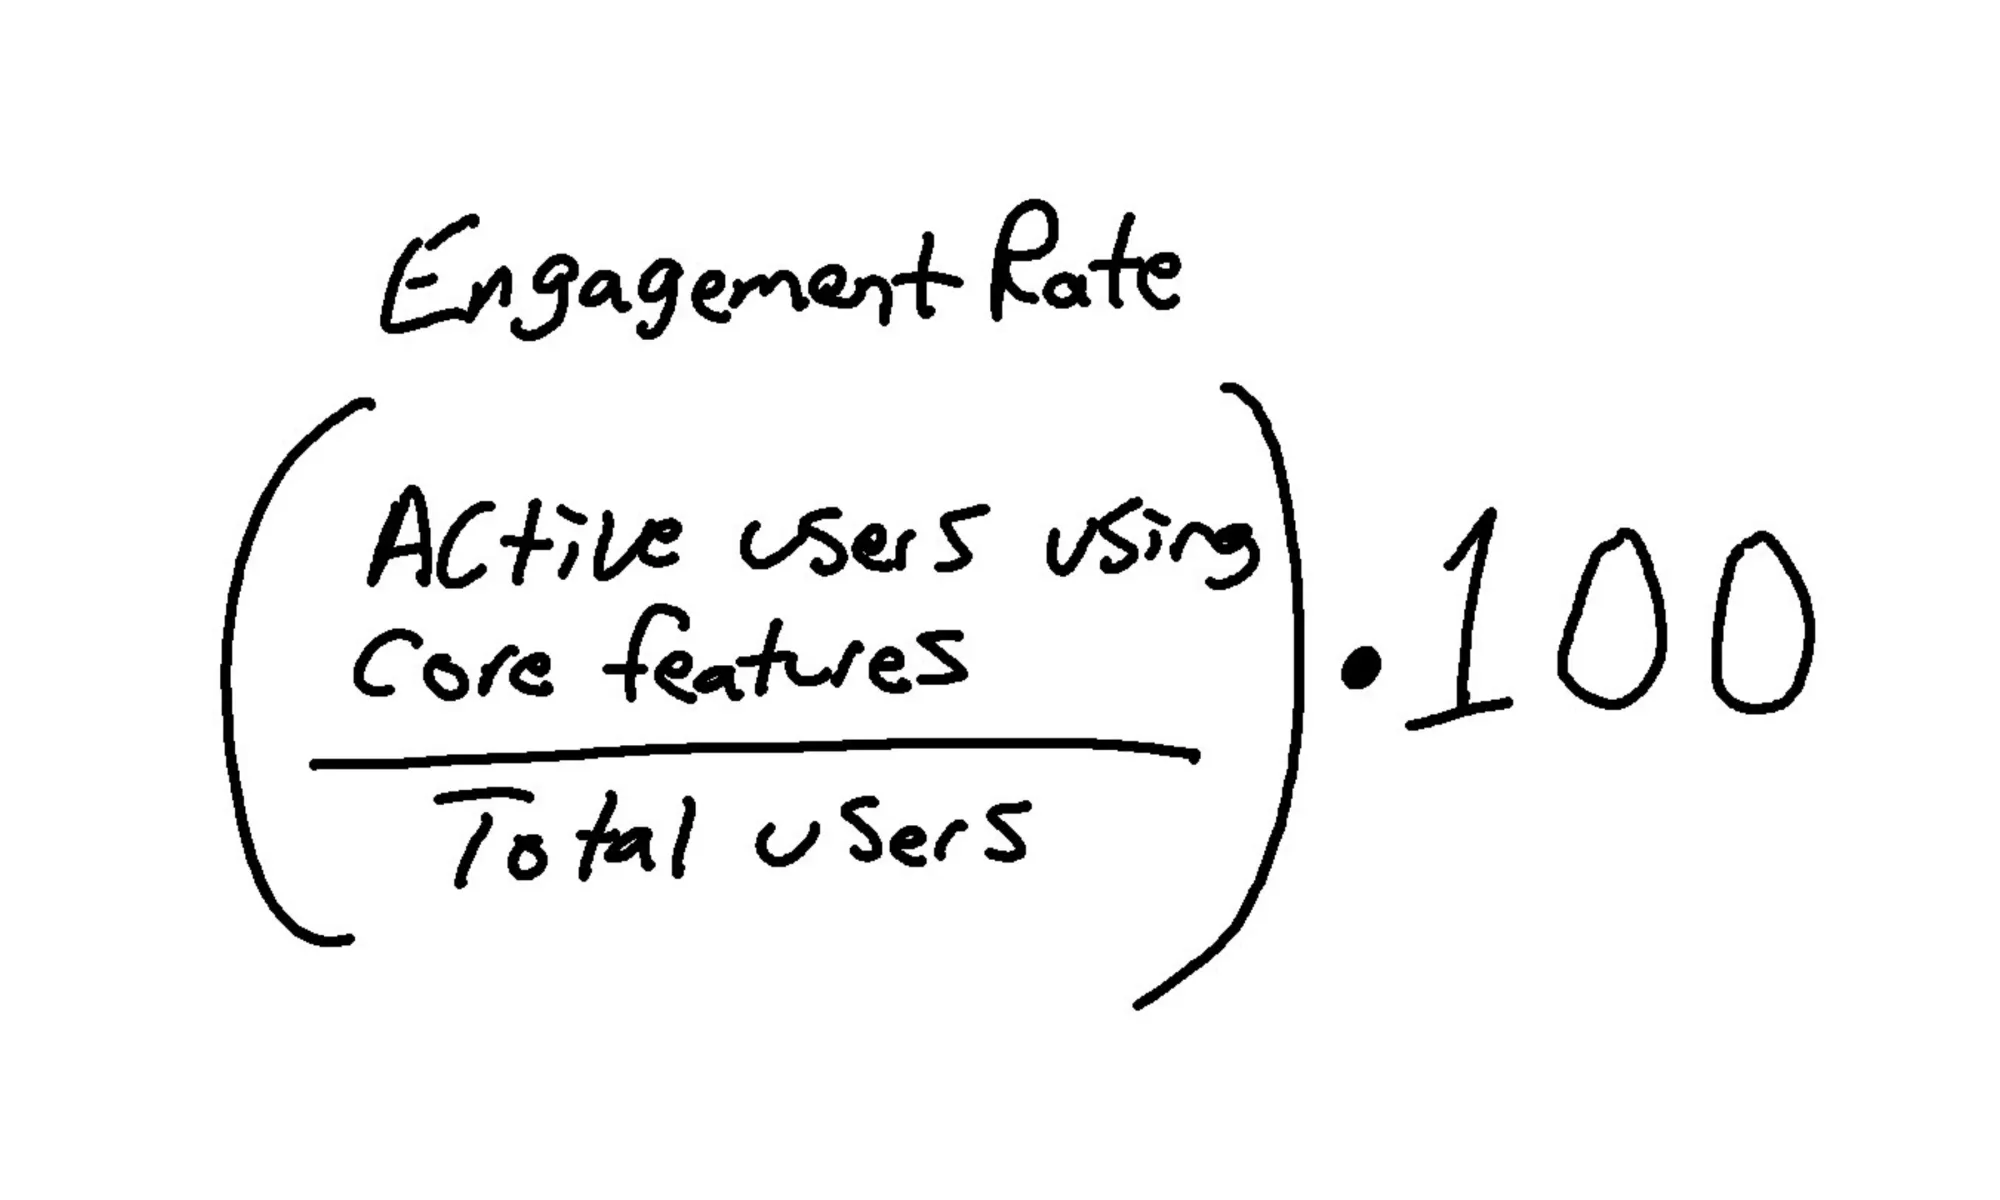
The engagement rate can help indicate momentum and user excitement, helping indicate future success and potential trends you can invest in.
But we also know that many apps start with high engagement and then drop immediately (see the social media industry for apps like Clubhouse as examples).
A SaaS company can measure the users using core features, in-app feedback, community interactions, and more.
The sister to engagement rate, and a good indicator of longevity, is product usage frequency.
Usage frequency calculates how many times a customer uses your product in a given time. It’s the difference between a used e-reader that looks brand new and one that is dented and scratched—you know which is the favorite.
This is a great way to determine at-risk users and assess the health of your product. If it’s relatively untouched, there’s a good chance your health needs some fine-tuning.
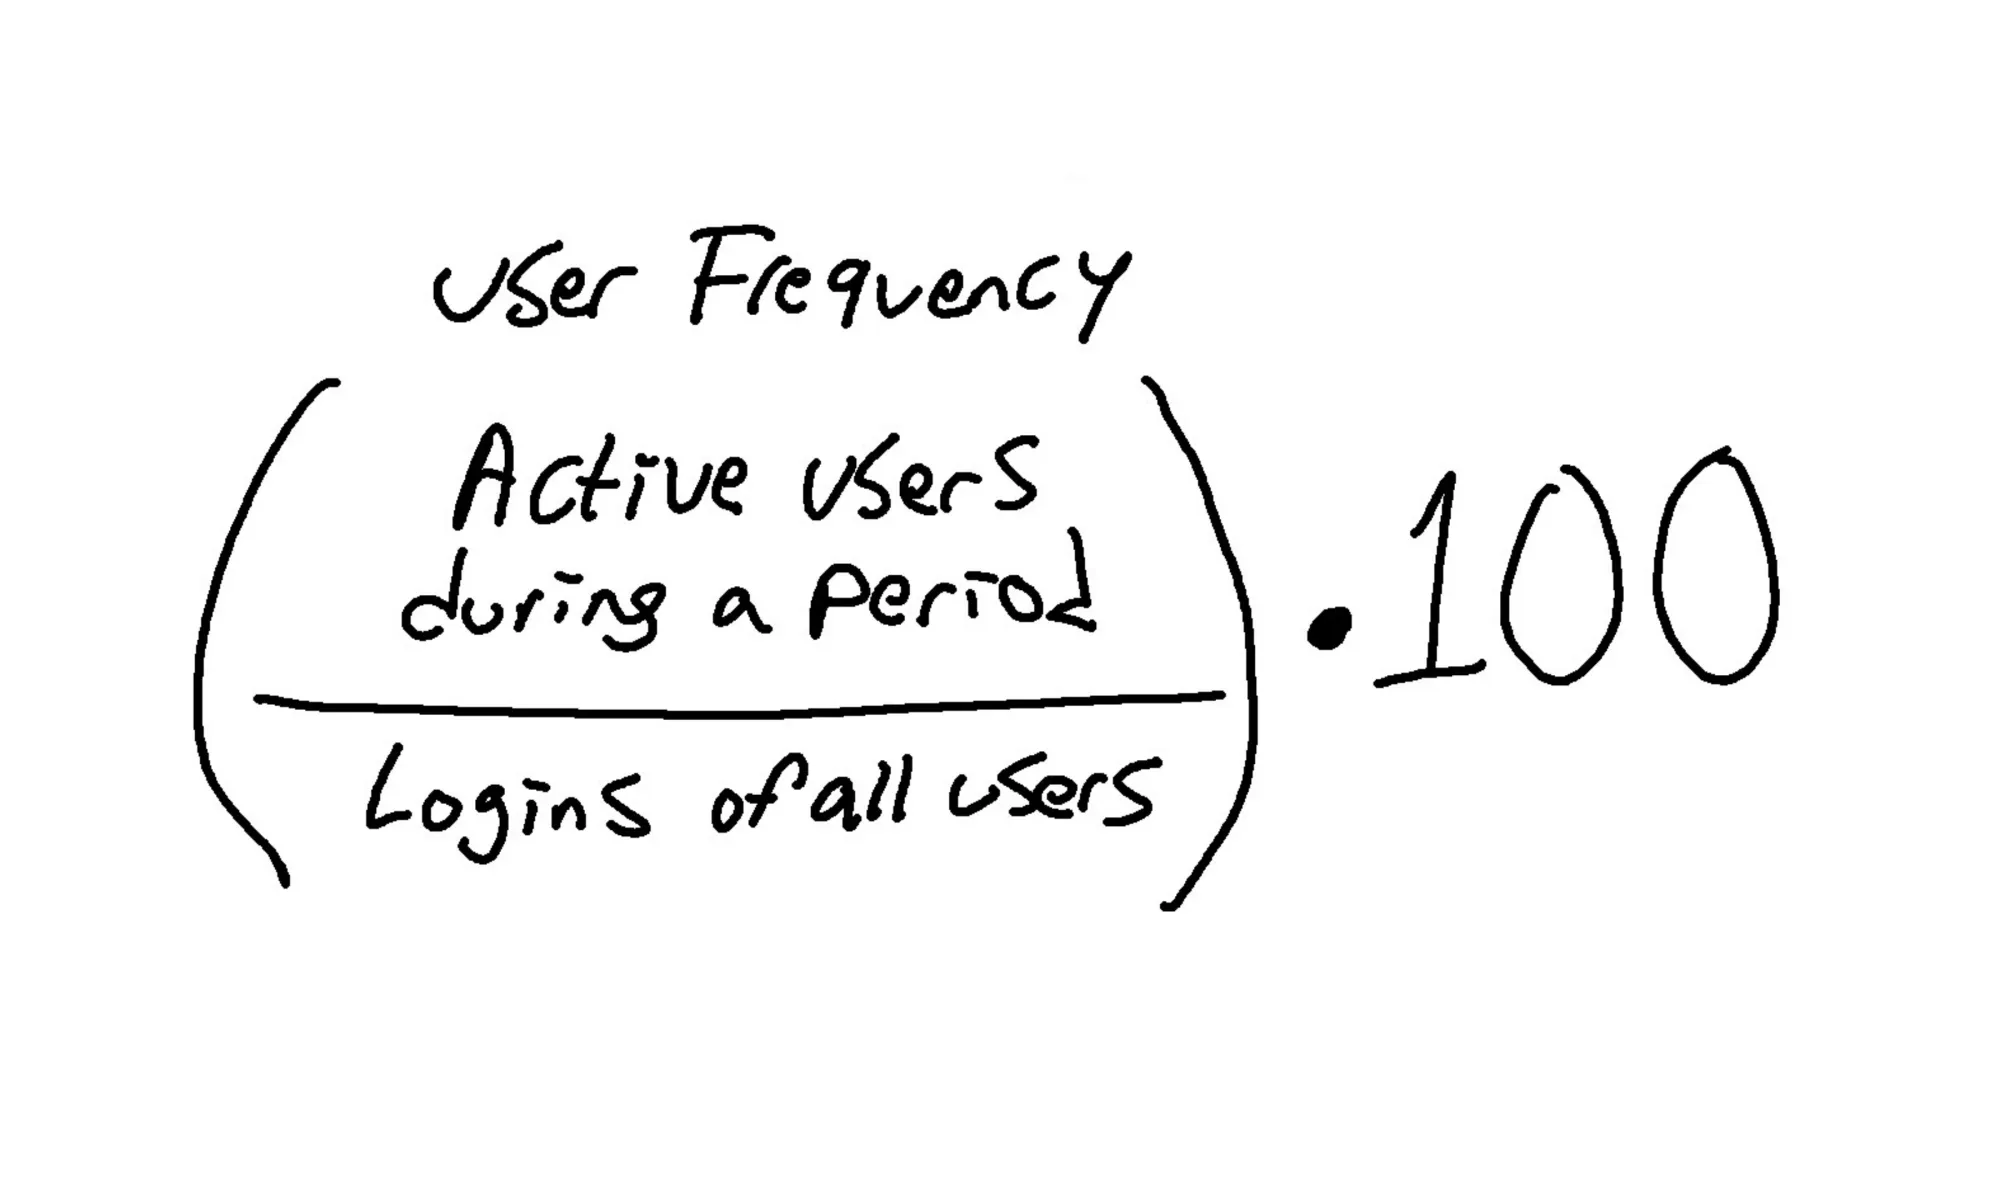
One way to calculate the product usage frequency is by dividing the number of active users during a certain period by the number of user logins. Multiply by 100 for a percentage.
5. Customer lifetime value (CLV)
You could implement your adoption metrics, and you see some improvement. But what does it look like five years from now? Are customers happy and willing to invest more in your platform?
The best way to get a glimpse of user satisfaction is by measuring how much a customer spends and for how long. It’s like that loyal regular customer that takes the speed train—same time, same day without fail. She likes ordering food in the dining car. The customer grabs the same coffee order from you (black, no cream, no sugar), and she calls you by your workplace nickname (the one you pretend not to like, but secretly do).
You can implement a customer lifetime value (CLV) metric to assess your average time cycle for users and how you can improve. The formula is:
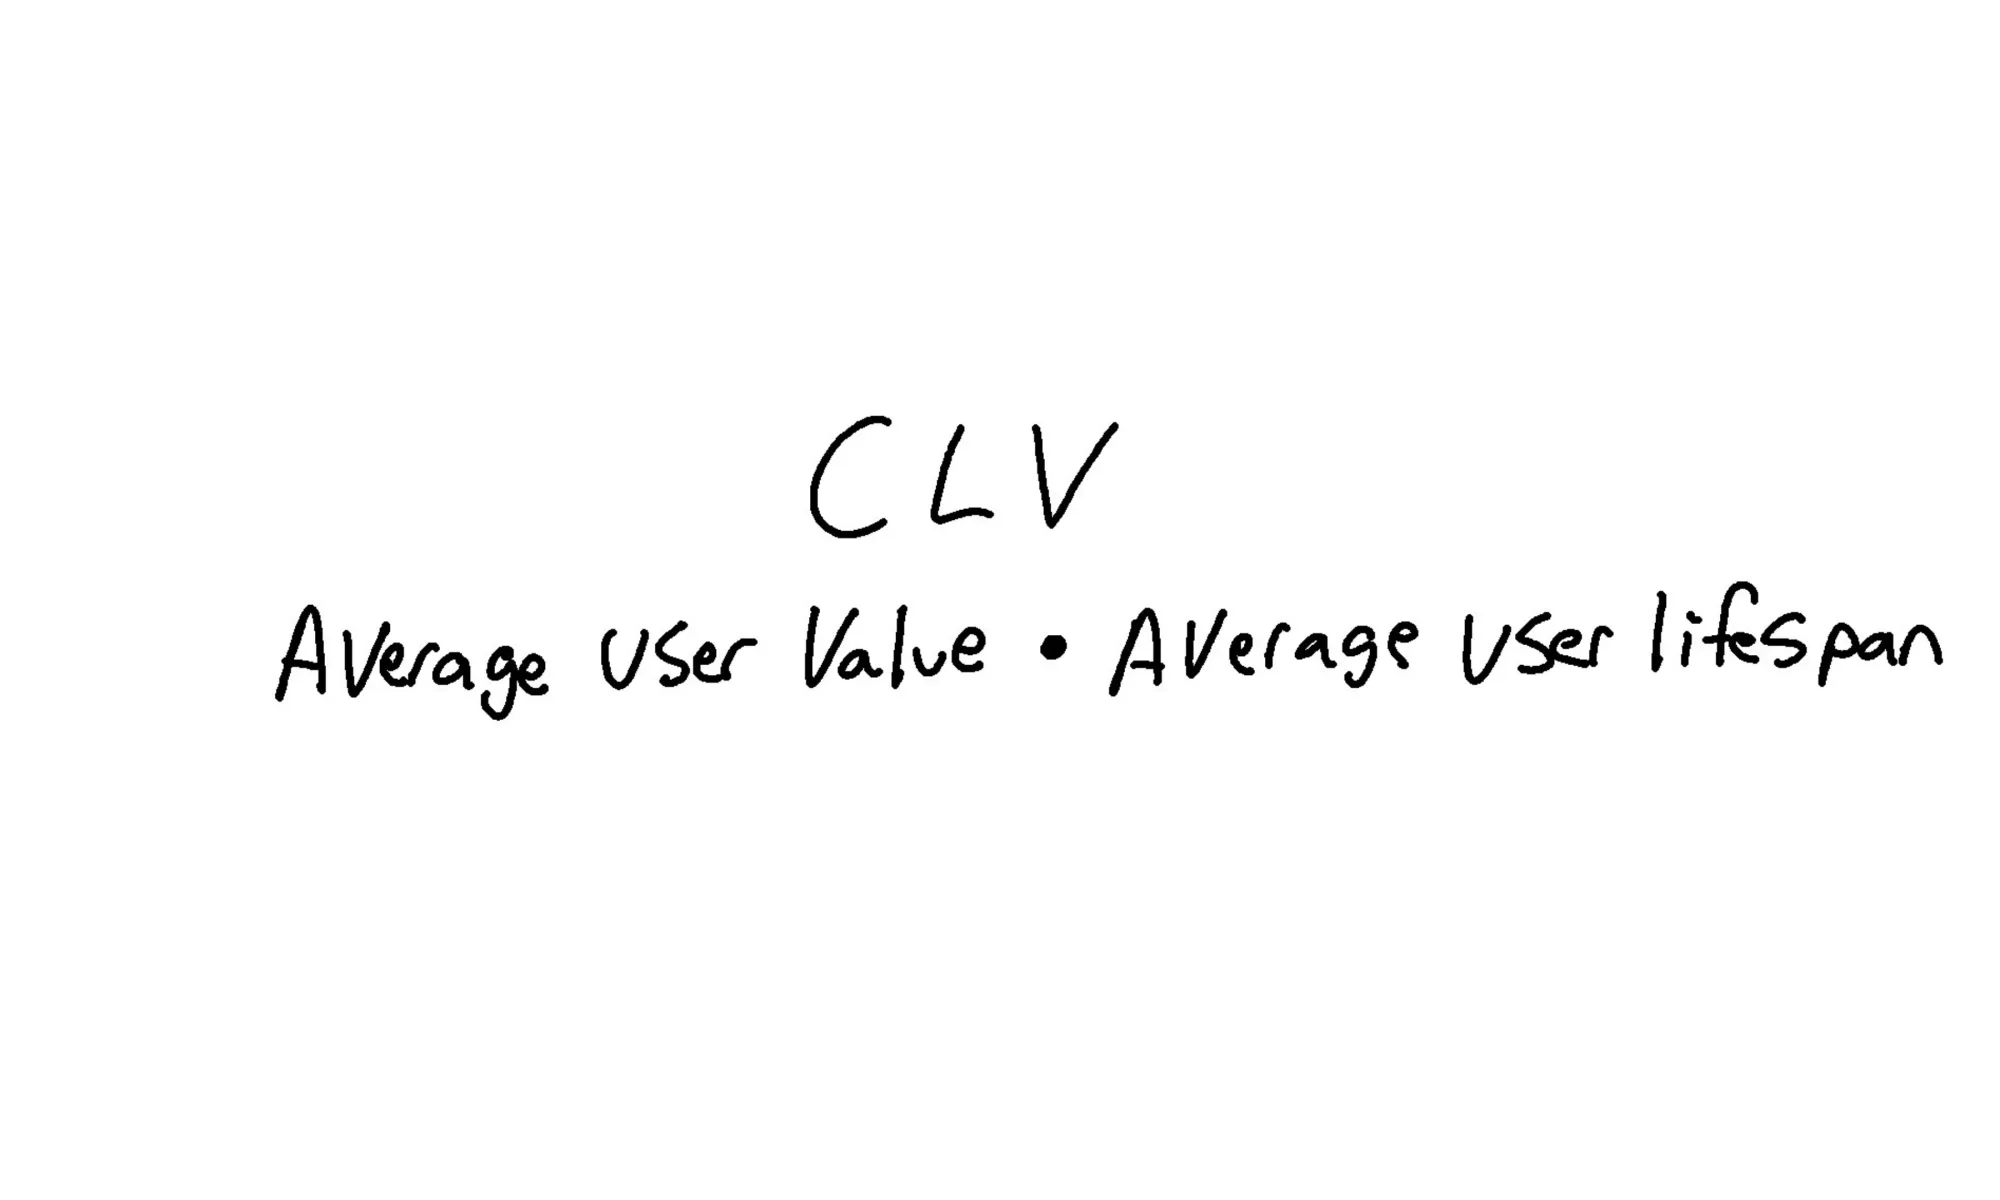
To get your user value, divide the total user purchases by the number of purchases. Calculate the lifespan by adding up how long users are active on your app divided by the number of users.
CLV is an excellent summary metric that is helpful in forecasting a business, but you need to consider it alongside your churn and retention rates for a more holistic picture.
6. Net promoter scores (NPS)
The net promoter score (NPS) can help you calculate customer loyalty and satisfaction.
You can calculate it through a survey or feedback feature. You ask users how likely they are to recommend you. Then, you compare positive responses to the negative.
You base it on a 1-10 rating in the survey. Six and below would be your negative responses (the detractors), while your optimistic responses (the promoters) range from seven to 10. Some companies are stricter and consider promoters nine and above—it ultimately depends on your benchmarks and analyses. The in-between values are passives.
Passive scores can be insightful because they include people who may not badmouth your brand but won’t champion it, either. They haven’t been sold on your value. You can identify these people and find a way to bridge the gap to adoption.
To get your NPS, calculate the percentage of your positive ratings. Then, your negative percentage. Subtract your positive percentage from the negative one to get your net promoter score.
By the end of this adoption metric walkthrough, you, the train conductor, analyzed the habits of your passengers on their route to success.
Case study: Metrics driving real change
Social media management company Statusbrew helps teams build winning content and presence for their audience.
Statusbrew understood the importance of adoption metrics. And the one glaring fact it faced was that its churn rate was too high. This required going back to the basics to understand why users left and how to get them to stay instead.
Statusbrew’s first revelation was that churn is often a gradual process, not an impulsive decision. The missing piece of the puzzle was how customers slowly arrived at the point that they left and how the brand could stop that poor experience in its tracks.
The brand decided to bolster its customer success team. It implemented a live chat so the team could communicate with customers. The company also redesigned the cancellation page, so users had to provide reasons for leaving, which helped inform the team for improvement.
Statusbrew also integrated Slack to notify the customer support team when a user canceled. They would research the issue and solve it quickly so it wouldn’t affect other customers (like a bug or a frustrating experience).
The team added more steps to ensure that they understood the reason for their churn, worked hard to prevent unhappy users from leaving by changing their experience, and improved the app so that there would be fewer cancellations in the future.
The result? The company reduced its churn rate by 20%! By embracing the metrics and incorporating other analytics, Statusbrew was able to shift the company narrative and grow.
All aboard! Continuous improvement with metrics
When you dive into your adoption metrics, you might face bad news at first. It can feel like missed opportunities that are too late to recover. But the good news? You can do something about it.
Getting a clear picture of your company that helps you craft a roadmap to success. Instead of planning your business out in the dark, you can now scale your company for positive results.
You don’t want to be blind to the aspects of your product that push customers out at the next stop. That’s why companies need a strong product and user adoption platform for their user experience.
Customers should be able to onboard effortlessly and enjoy the process. No annoying pop-ups. Just gentle guidance as they explore their curiosities and learn how to use your platform. They quickly get their “aha” moment and see the value of your product with checklists and nudges that lead them to the right place.
These tactics are game-changers for new users who are tired of clunky onboarding experiences and adoption strategies.
Imagine a user who starts getting to know your app. They have a question and ask an AI Assistant. The bot answers immediately and points them in the right direction if the customer wants more information. Tools like CoPilot by CommandBar provide 24/7 AI assistance when customers need help—all based on your docs, web pages, and HelpHub.
There are many opportunities to turn adoption upside down for customers—from waiting too long at the train station to enjoying a cocktail in the first-class dining car. You can make adoption fun and easy.
Scale your company for positive growth with purposeful user adoption metrics and the right tools to improve.