


As SaaS companies vie for user attention and loyalty, the search for the perfect way to measure (and boost) user engagement has become a major priority. Enter the Product Engagement Score (PES), touted as the Holy Grail of understanding user interaction with software products. But here's the catch: this may not be as much of the end-all-be-all of engagement metrics as it’s said to be.
This is not to say that it’s an unimportant metric to track; it just may not be the best gauge of engagement for every product. But before we talk about the downsides, let’s chat a little bit about what this metric is and how you determine it.
What is product engagement score?
The product engagement score is a metric that was created to give you a singular view of how much your users are interacting (i.e. engaging) with your product.
An accurate gauge of the extent to which your users engage with your product is essential to help your team craft effective strategies to reel them in even more. When used the right way, this metric can help you increase customer retention, shape the product enhancements you prioritize, and boost your product adoption.
How to calculate product engagement score
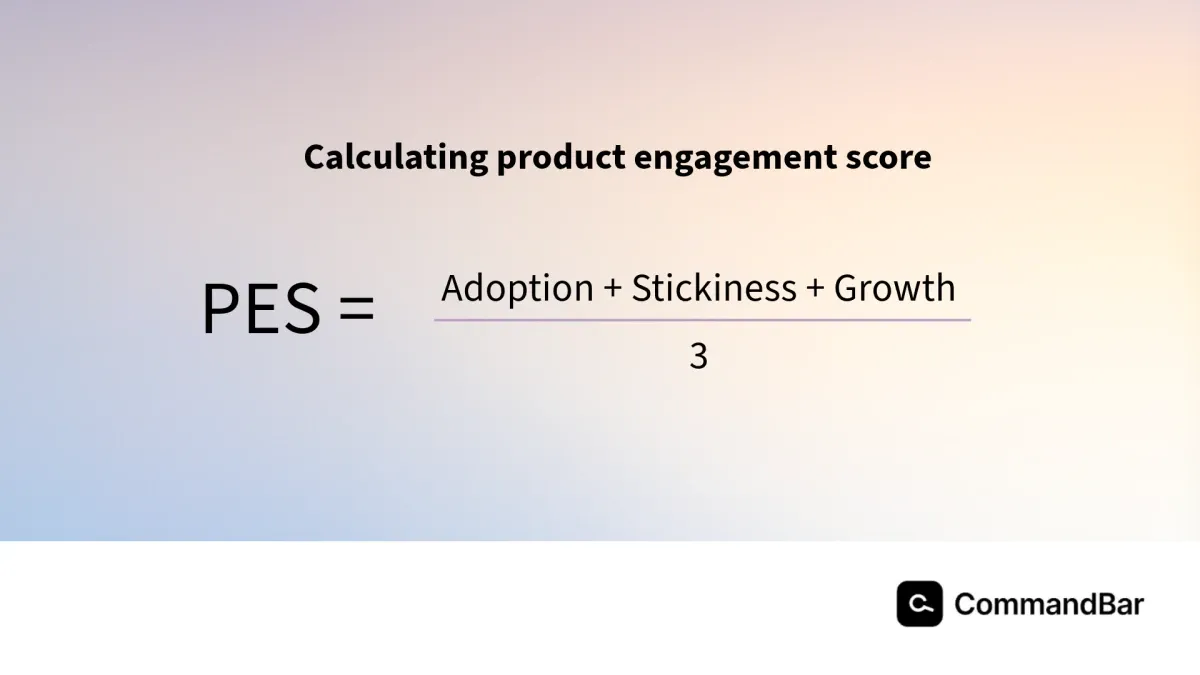
To calculate this metric, you’ll need three key pieces, typically each calculated as a percent:
- Adoption - How widely and deeply users use key features or functionalities within the product.
- Stickiness - A measure of how often users return to the product regularly, reflecting habitual usage patterns and sustained engagement over time.
- Growth - The rate of expansion in the user base or usage volume.
The typical formula to determine the product engagement score is to add up these 3 numbers and divide them by 3.
Here’s how this calculation may look in practice:
- Product Adoption:
- Let's say there are 5 core features, and you measure the average number of features adopted by each active user. If the average number of adopted features is 3 out of 5, the adoption score would be 60%.
- Stickiness:
- You could measure stickiness by calculating the percentage of weekly active users who return to the platform daily. Let’s say you have 1,000 weekly active users, and out of those, 600 return to the platform daily. The stickiness score would be 60%.
- Growth:
- You can measure growth by determining the ratio of new/recovered users to dropped users over a specific period (Quick Ratio). If you gained 200 new users and recovered 100 inactive users while losing 150 users during the period. The growth score would be ((200 + 100) / 150) * 100 = 200%.
In this example, your product engagement rate would be calculated as follows: (60+60+200)/3 = 106.67%
But this isn’t the only way to measure product engagement
While adoption, stickiness, and growth seem like good ways to gauge engagement in your product, it can be a little overly simplistic. While this may work for the majority of products, it may not get to the heart of what meaningful engagement looks like in other products.
And this miscalculation of the true engagement can lead to a disconnect between you and your users. This disconnect is clear when you look at the stats:
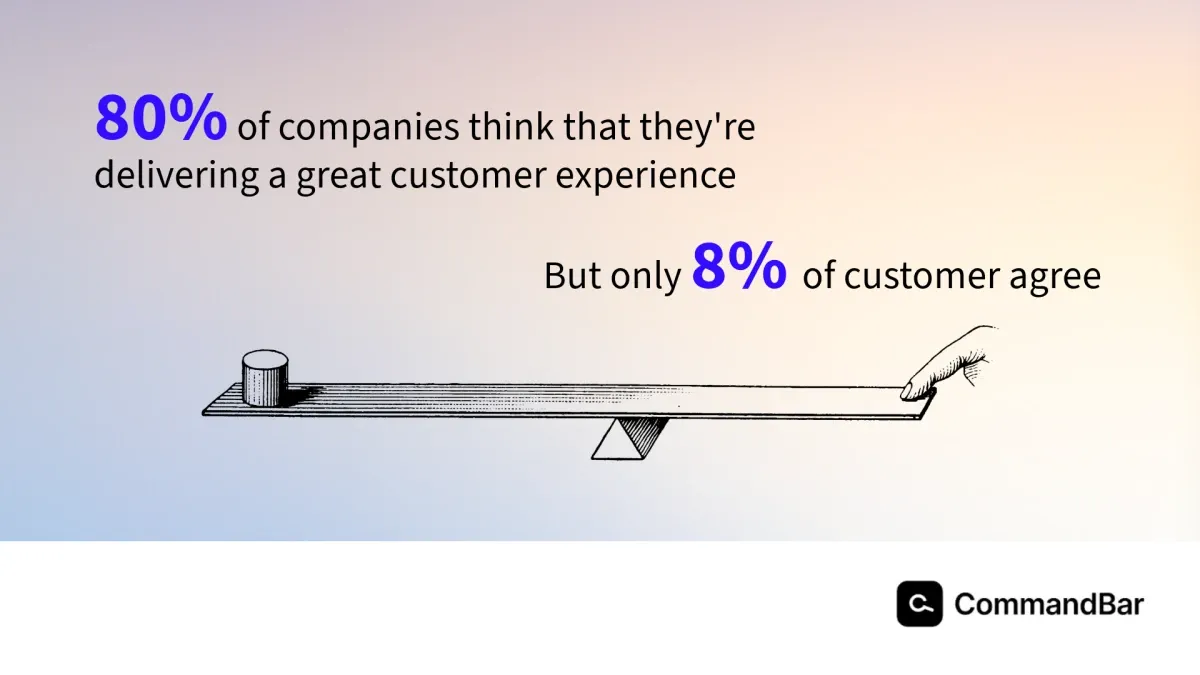
According to a study by Bain and Company, while 80% of companies think they’re delivering a great experience, only 8% of customers agree.
While some of this sentiment by companies could be an effect of a guessing game or fudged metrics, a big culprit could be that, based on the way they measured this engagement, the numbers really are saying users are engaged. They’re just not measuring the right thing.
So, while we’re not saying that product engagement score is useless in every instance, you need to make sure that you take the time to consider whether it’s aligned with your actual business goals.
Determine what you consider “engagement”
The first step is to map out what valuable engagement looks like in your product. Consider the actions that you want your customers to take that will most likely lead them to “get” your main value proposition and are a clear indicator that they’ll remain loyal customers.
This will vary based on industry, target audience, business goals in that moment, and the general nature of your product.
So while adoption, stickiness, and growth may very well be good indicators of engagement, here are some alternative quantitative metrics to consider:
- Retention rate
- Churn rate
- Conversion rate
- Customer satisfaction score
- Session duration
- Active users
- Frequency of use
- Adoption rate of specific features
- Click-through-rate from in-product pop-ups
This list, of course, is not exhaustive but should just serve as a starting point to get the gears turning about the expanded possibilities of what engagement looks like.
I want to make it extra clear how this difference in measuring true engagement can look by comparing examples from two different hypothetical companies:
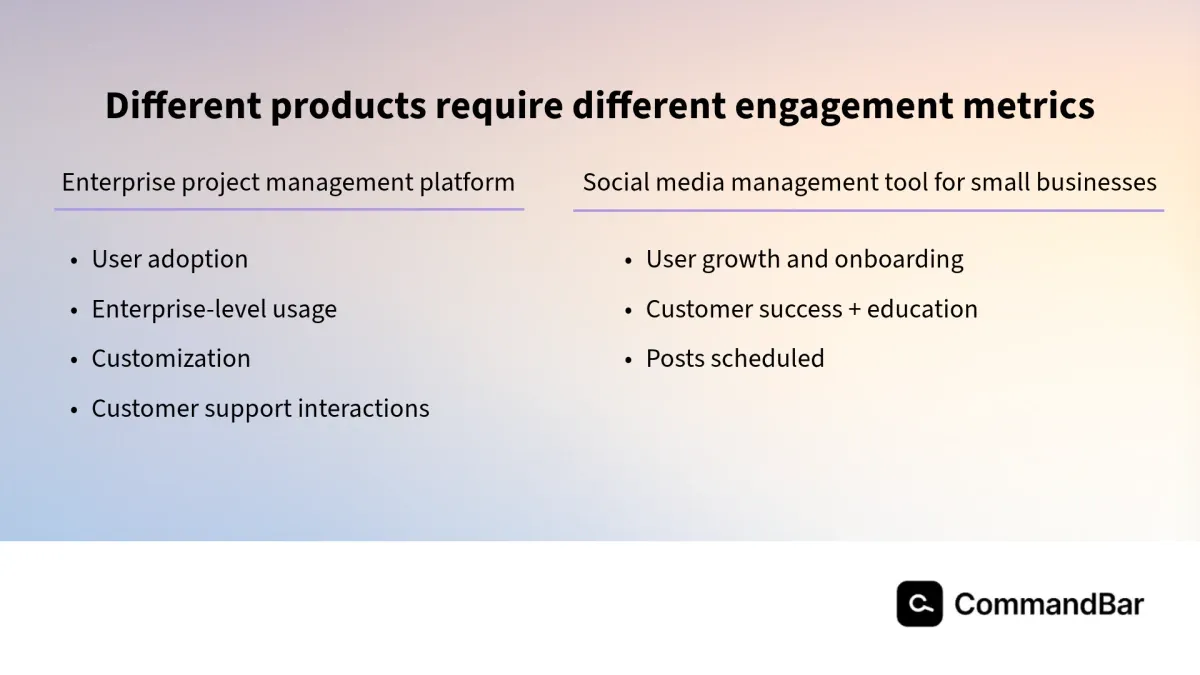
Company A: an enterprise project management platform
Their main metrics to determine product engagement are:
- User adoption - The number of teams onboarded, percentage of users actively using advanced features, and integration with other enterprise systems.
- Enterprise-level usage - Given their focus on large enterprises, they want to track the depth and breadth of usage within each organization, like the number of projects managed, the volume of tasks completed, and the frequency of collaboration among team members in the platform.
- Customization - How many customization opportunities users take advantage of, indicating a deeper commitment to the platform.
- Customer support interactions - Since enterprise customers often require a lot of dedicated support, they monitor the volume and nature of interactions with customer support, including inquiries, tickets raised, and resolution times.
Company B is a social media management tool for small businesses
By contrast, they measure engagement by tracking:
- User growth and onboarding - They focus on metrics related to user acquisition and onboarding, such as the number of new sign-ups, the rate of trial-to-paid conversions, and the time taken for users to set up their accounts and start using the platform.
- Customer success and education - Since small businesses may require guidance in using the platform effectively, they track interactions with educational resources, attendance at webinars or workshops, and participation in user forums or communities.
- Posts scheduled - This is perhaps a more meaningful engagement metric than time in platform or features used since this gets to the core of what they want to help their customers do. And less time may actually be a benefit if they’re hoping to help users speed up the time needed to post to social media.
Other ways to calculate product engagement
Once you determine the metrics that best align with your business goals, there are other ways of calculating your ultimate engagement score than adding them up and dividing them by three. Here are some other options for you to try.
Weighted average
While the product engagement score assumes that all 3 engagement metrics they use are of equal importance, that may not be the case. So, no matter what metrics you use (or how many), you may want to assign percentages of importance to each metric you’re using.
For example, for active users, time spent in the platform and conversion rates are the key metrics you’re using, but active users is the most meaningful, you can assign the following weights to each metric: 40% for active users, 30% for time spent, and 30% for conversion rate.
You can then use those three weighted metrics to calculate the weighted mean.
Cohort analysis
Perhaps measuring engagement broadly may not be getting to the root of your true engagement, since it may vary greatly from one group to another. In this case, you may want to analyze user engagement metrics within specific cohorts or segments (i.e. new users vs. returning users).
This comparison can reveal valuable insight into moments when your engagement is strong, and what may be causing it to falter in other parts of the user experience. You can use these comparisons to identify trends and patterns in user engagement over time, rather than a single moment-in-time snapshot.
You may also want to use qualitative metrics
Not everything is so easily quantified in a number. Perhaps quantitative metrics like the ones we’ve been talking about up until this point may not be the best way to measure engagement. You may want to dig into more anecdotal data to notice emerging trends or themes in your users’ engagement habits.
In-product surveys are a great way to gather this data. You can request feedback from your users are certain steps in the journey to hear directly from them about their in-product experience. While some of this data could be expressed in numbers, you may also want to give users the chance to enter free-response answers to learn more about concepts that you may have never thought to ask about.
This qualitative data can also be gleaned from certain user assistance tools that you use, like an AI-powered copilot. You can look directly at the conversations that your users are starting, giving you insight into things like areas they’re interested in learning more about and areas where they hit a wall.
The end goal: create more helpful, engaging products
Measuring product engagement is just a step in the journey of creating better, more engaging products. So you don’t want to lean on measurement that’s little more than checking a box. The metrics you use to measure engagement should give you direct insight into what you should keep doing and what resources you should invest in improving.
Once you have a clear picture of how your users are engaging with your products, that’s when it’s time to implement tools that can help you to actively lean into the components of your user experience that are the most engaging. Whether that’s using non-annoying pop-ups with tips to make the most of your platform, seamless in-app help, or onboarding checklists to get your users started on the right foot.
If you’re intentional about measuring engagement in the right way, and using the insights you get from those metrics to craft a more engaging experience continuously, you’ll be unstoppable.