


What’s the one thing a SaaS business has in abundance, perhaps in too much abundance?
Data.
Every time someone purchases your platform, every sign-up, every click within the product – all generate data.
What’s hidden in this data?
- User intent: Are users excited only on the first day when they sign up, or will they truly stick around?
- Future predictions – is your monthly revenue likely to keep growing or is it at risk of stagnating?
- Signals and patterns – are users finding something irksome? Something awesome? Which way is the market leaning?
The answers to these and many more questions are contained within your data. But as with everything in abundance – it’s easy to get overwhelmed, perhaps even sick. Recall those Halloween nights from ages ago when you stuffed yourself silly with all those candies only to wake up with an upset stomach the next morning? Yeah, just like that, data deluge can turn into a real pain.
Knowing how to track the right SaaS metrics and reporting them to stakeholders can spell the difference between an average business that just gets by and a business that thrives as a market leader – not to mention all the pain it takes out of having to monitor all those vast datasets.
Let's dive into how you can decide which metrics matter the most for your business and how to translate them into insights that different teams can use to grow the business.
Why does spending time on SaaS reporting make sense?
Many SaaS businesses follow a subscription model. However, SaaS reporting goes beyond reporting on how your subscriptions are performing. They help you develop a clear picture of the health of your entire business.
There are 3 areas in which SaaS reports can help you –
- Understand customer acquisition: As a business, you tend to spend significant time and effort on marketing campaigns and sales initiatives. But not all tactics are equal. Some attract more high-value customers and deliver a positive return on investment. In contrast, others might turn into budget black holes – sucking in all the resources without delivering a sustainable customer base. SaaS reporting helps you decide on the right strategies and channels.
- Get insights into user engagement: You may have developed a product with specific use cases in mind, but a user may find good use for other features. Or the opposite could be happening – the user finds your workflows confusing. Either way, you need insights into user engagement to understand activation rates, adoption rates, friction points, and opportunities for enhancing the customer experience within the product.
- Know what makes users stay and what makes them go away: Just because someone signs up for your product doesn’t necessarily mean they will use it. Organizations invest in communication apps like Slack, yet if users are more comfortable using WhatsApp (since they use it for personal messaging anyway), they will continue to ping their colleagues on WhatsApp. Or if your sales folks are used to sending meeting requests via email, adopting a platform like Calendly could see some initial resistance. Understanding why users churn can help you craft strong retention strategies.
Beyond internal insights, SaaS reporting will also help you –
- Keep your investor's confidence: SaaS metrics have become an important benchmark to track performance and growth and this is how investors evaluate startups. Unlike passionate rhetoric or subjective claims, data provides evidence of your financial health and growth. It helps investors envision what your growth trajectory could look like and what kind of returns they can expect on their investments.
- Maintain a competitive advantage: By comparing your performance against industry benchmarks, you can understand the gaps and opportunities that exist. Benchmarks tell you where you might be lagging behind others or which areas you are excelling in. You can come up with areas of differentiation that set you apart in a crowded world. You can also predict and preempt challenges. Say you capitalized on the work-from-home (WFH) trend during COVID-19 by developing a platform for remote collaboration. With businesses now revoking the WFH policy and people returning to the office, how will your product adapt and remain relevant? Your SaaS metrics can help you foresee such trends and plan on the path to take proactively instead of reactively.
How to prepare your SaaS report
Data is no good unless you can convert it into meaningful reports and derive actionable insights from them. Here’s how you can go about creating SaaS reports that are relevant to the context you operate in.
Decide what you want to track
Before plunging head-first into a pool, you decide your moves – are you going to swim freestyle or do butterfly strokes? In the same way, before you dive into data you must decide your objectives – why are you building this report? What questions do you need answering? Do you want to improve how you acquire new customers, boost user engagement, or find ways to reduce churn?
Once you know what your reporting objectives are, you can decide the metrics to track.
Choose a tool that makes reporting easier
There are many analytics and business intelligence tools in the market you can choose from. Popular options include Mixpanel, Sisense, and Zoho Analytics, but there are many more to choose from.
Consider these factors to select a tool that’s right for you –
- Integration with data: Can the tool connect to various data sources, such as CRM, website analytics, and product usage data?
- Visualization capabilities: Can the tool present reports and insights in easily digestible formats like dashboards, charts, graphs, tables, etc.?
- Level of customization: Do pre-built templates or reports exist? Can you tailor your reports to include only specific metrics or slice-and-dice data according to target segments?
Establish a reporting process
Decide how often you need to build and analyze reports – will it be weekly, monthly, or quarterly? Weekly reports are great for monitoring trends in real time. Monthly reports show you a broader view of performance. Quarterly reports can be used to understand long-term trends and assess progress toward strategic business goals.
Also, decide who needs to see these reports and why. Executives prefer summaries with key performance indicators (KPIs) to track the overall health of the business. Marketing teams need in-depth reports on customer acquisition, campaign performance, and lead generation metrics. Sales, on the other hand, wants to focus on conversion rates, sales pipeline health, and customer lifetime value (CLTV). Customer success teams like knowing the NPS (net promoter scores). And of course, the product owners need to know the feature adoption rate and how user engagement is progressing.
By clearly defining the who and why of reporting, you ensure everyone receives the information they need to make proper decisions.
Uncover patterns and insights
Look for trends, patterns, and correlations in your data. Here are some techniques you can try –
- Look for changes over time: Are sign-ups increasing? Is there a significant drop-off after the first sign-in? Do you have a high churn rate?
- Spot patterns: Does feature adoption depend on a user’s location? Do customers coming in from a specific channel have a higher CLTV?
- Segment your data: Don’t treat everyone as if they belong to the same group. Find the right factors for segmentation – firmographics, subscription plan, region, etc. This helps you account for variations in behavior. For example, users on a team plan of your product may exhibit different engagement patterns to those on a higher level of subscription like an enterprise plan.
Report to your stakeholders
Don't overwhelm your stakeholders with raw data – it's going to achieve nothing. Instead, extract key insights and present them in a clear, concise, easy-to-digest manner. Focus on the "what" and "why" – what trends are you observing, and why might they be happening?
Numbers have a lot of information, but let’s face it, they are dry. Make them interesting by telling a story visually – use charts, graphs, or dashboards to help your stakeholders grasp complex trends in a single glance. Personalize reports depending on the team you’re presenting to. CXOs need summaries of KPIs, marketing teams need deeper dives – tailor your presentations accordingly.
7 key metrics to include in your SaaS reporting
Sales pipeline
Think of this as a visual representation of your sales process. It maps out the journey of a customer – from the point they became a lead for your business to the time they become a paying customer. Two metrics that can help you assess the health of your pipeline – MQLs and SQLs.
Marketing qualified leads (MQLs) are people who show some interest in what you have to say. Marketing teams are usually involved in generating MQLs through various efforts like webinar registrations or downloading of ebooks. What makes MQLs interesting is that they are not some random website visitors or social media followers – they are actually interested in something that you shared. Which makes them a good fish to catch for the sales folks.
Sales qualified leads (SQLs) are one step further along in the sales pipeline. These are leads that have been vetted by the sales team for outreach. Many people could be interested in watching your webinar but only some of them would be interested in evaluating solutions. Such leads become SQLs.
Sales cycle length tracks the average time it takes to close a deal. Everyone prefers a short sales cycle length but the reality for B2B can be different. B2B purchases require more education and you have to convince a larger buying committee, so the sales cycle length could be long. At the end of the day, the sales cycle length tells you how fast you’ll realize revenue.
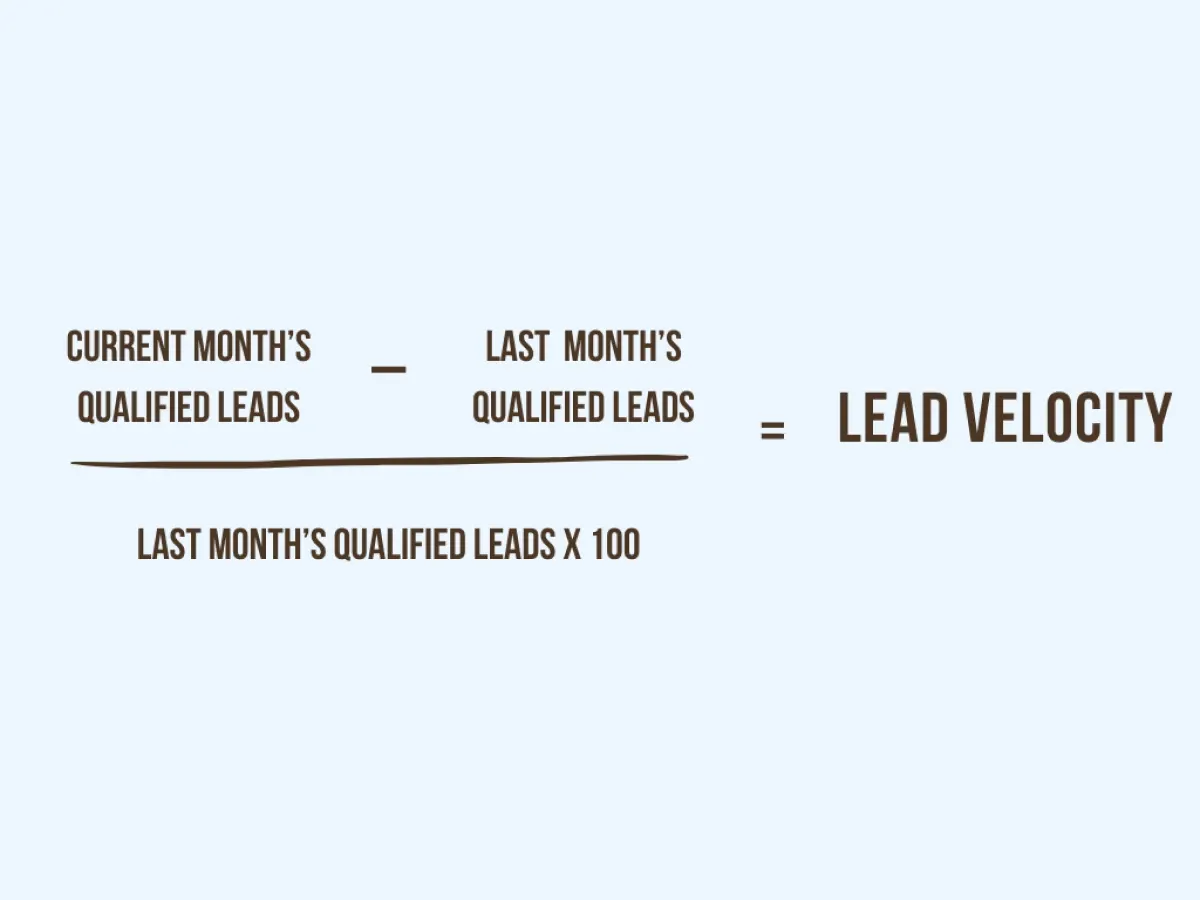
Lead velocity is another important metric to look at – it measures the speed with which leads move through your pipeline. A high lead velocity means you have an efficient sales process and your teams are quickly converting leads into customers.
Conversion rates are important to identify bottlenecks in your sales process. You can track conversion rates between any two stages – say from MQL to SQL – a low conversion rate here could indicate that marketing is not targeting the right audience. You could track conversion rates from proposal to deal closed stages – high rates here could indicate that your messaging and offerings work!
Revenue growth
Imagine being able to predict all the revenue for the year in a single snapshot – that’s your annual recurring revenue or ARR for short. It shows you how much revenue you can expect to generate in a year based on the current subscription plans.
Monthly recurring revenue, or MRR, is the monthly version of ARR. It shows you the predictable revenue you generate in a single month. While ARR shows you a long-term perspective, which is great for financial planning, MRR helps you identify early-growth trends, which is quite beneficial for startups and early-stage SaaS companies.
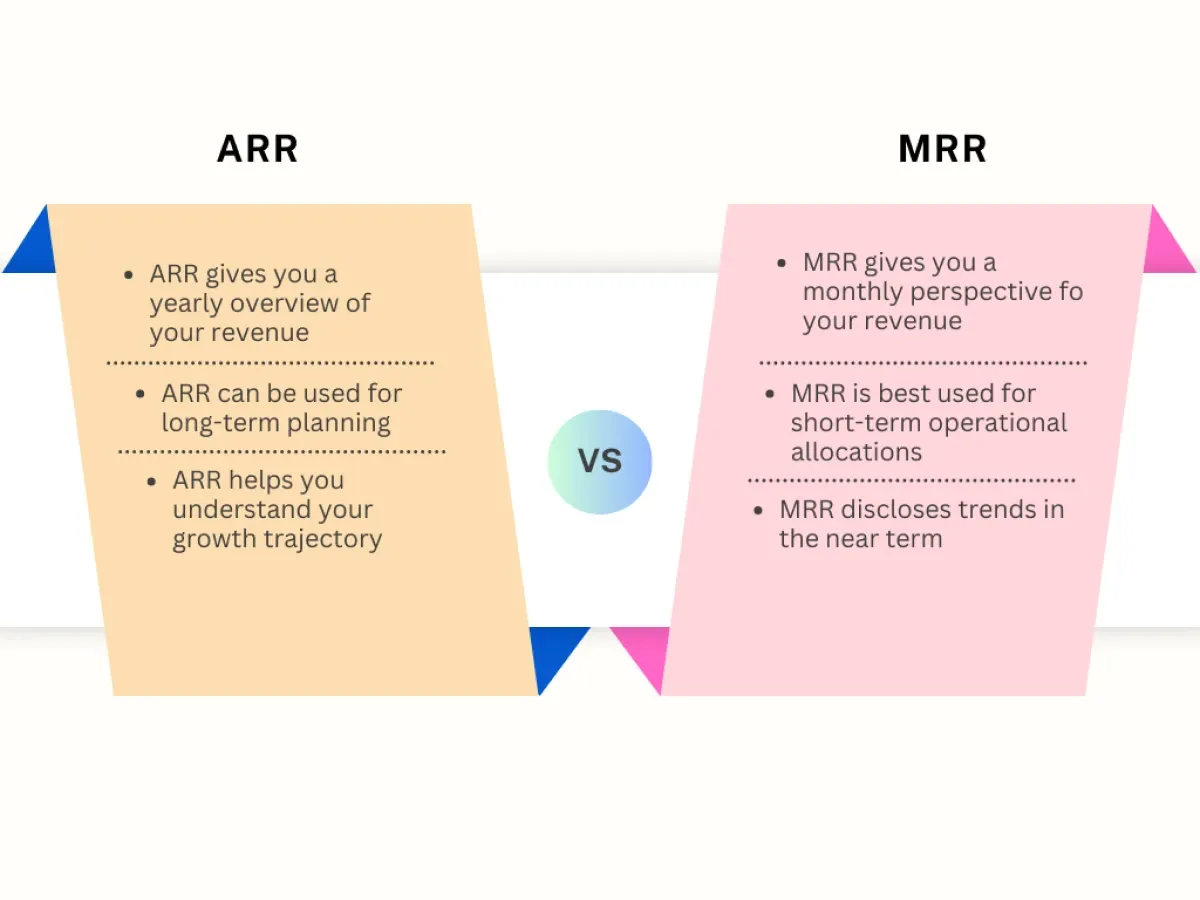
MRR gives you a snapshot of your cash flow – how much money is coming in every month so you can allocate your resources accordingly in the short-term. ARR, on the other hand, predicts the sustainability of your revenue stream – and it’s a number that investors love to dissect!
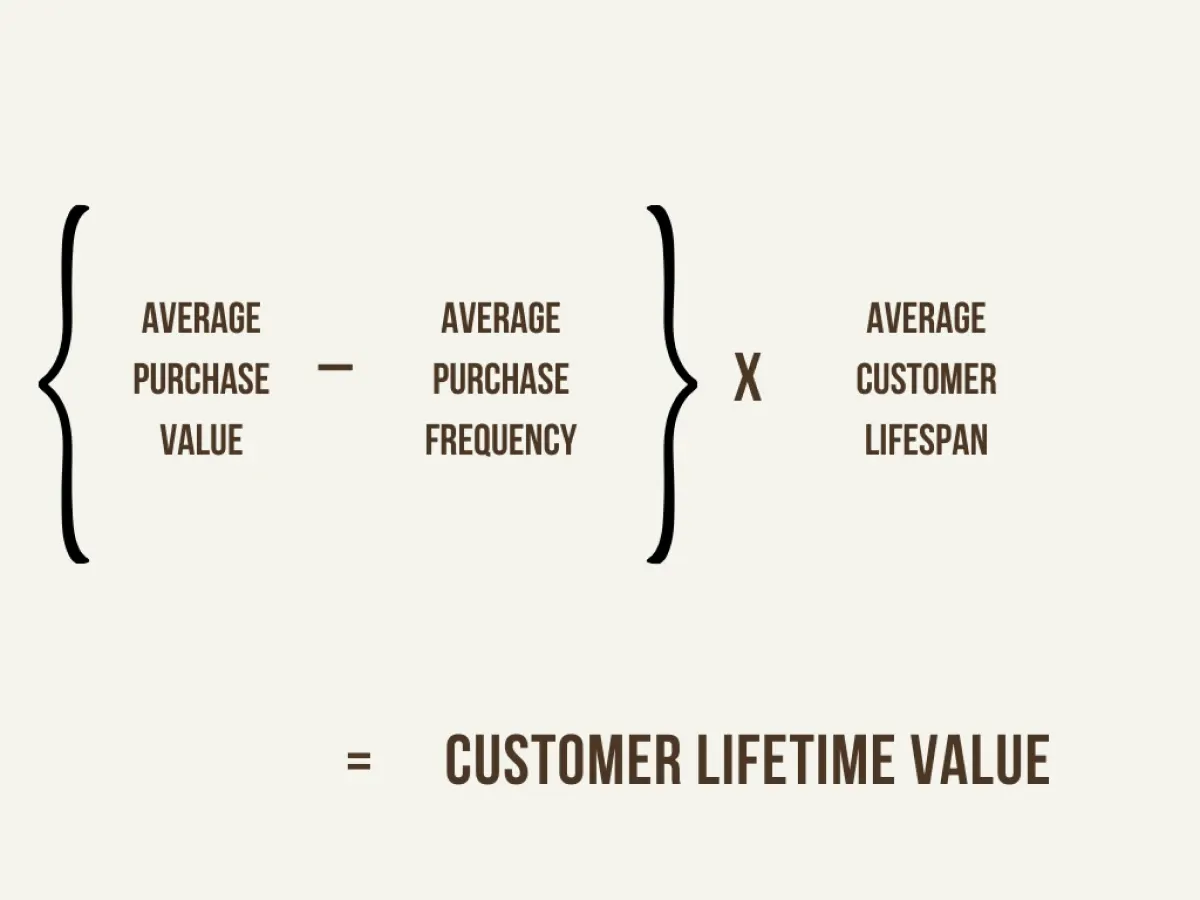
Customer Lifetime Value (CLTV)
CLTV goes beyond looking at just the revenue from the initial sale. It tells you the total revenue you can expect from a customer during their entire relationship with you. This shifts business focus from simply closing deals to focusing on customer retention instead.
As Babu John Mariadoss, an Associate Professor at WSU’s Carson College of Business says, “some customers are highly profitable, others aren’t, and others actually end up costing your firm money to serve.”
By narrowing down on the customer segments with the highest CLTV you can devise strategies to give them special attention, since these are your high-value customers and help you build a long-term growth trajectory.
Customer acquisition cost (CAC)
Every customer is a win – but what does that win cost you? CAC is a crucial metric that tells you the total cost associated with acquiring a new customer. This will help you assess whether your marketing efforts are costly. When the CAC is high it means that you’re spending too much to acquire a customer. But that’s not the only cost to factor in. The salaries and commissions paid to your sales team and the cost of marketing automation tools also add to this equation.
You want to be able to achieve a balance – yes, you need new customers but that should come at a reasonable cost. If the cost is too high, you can always prioritize your efforts toward customer retention, since companies with high performing retention strategies tend to grow 1.5 – 3x times faster than others.
LTV:CAC Ratio
While seen in isolation, both CAC and CLTV will give some indicators about the health of your business, but there’s a more powerful metric you can look at to get an even stronger indicator of whether your spending and customer acquisition are headed in the right direction – the LTV:CAC ratio.
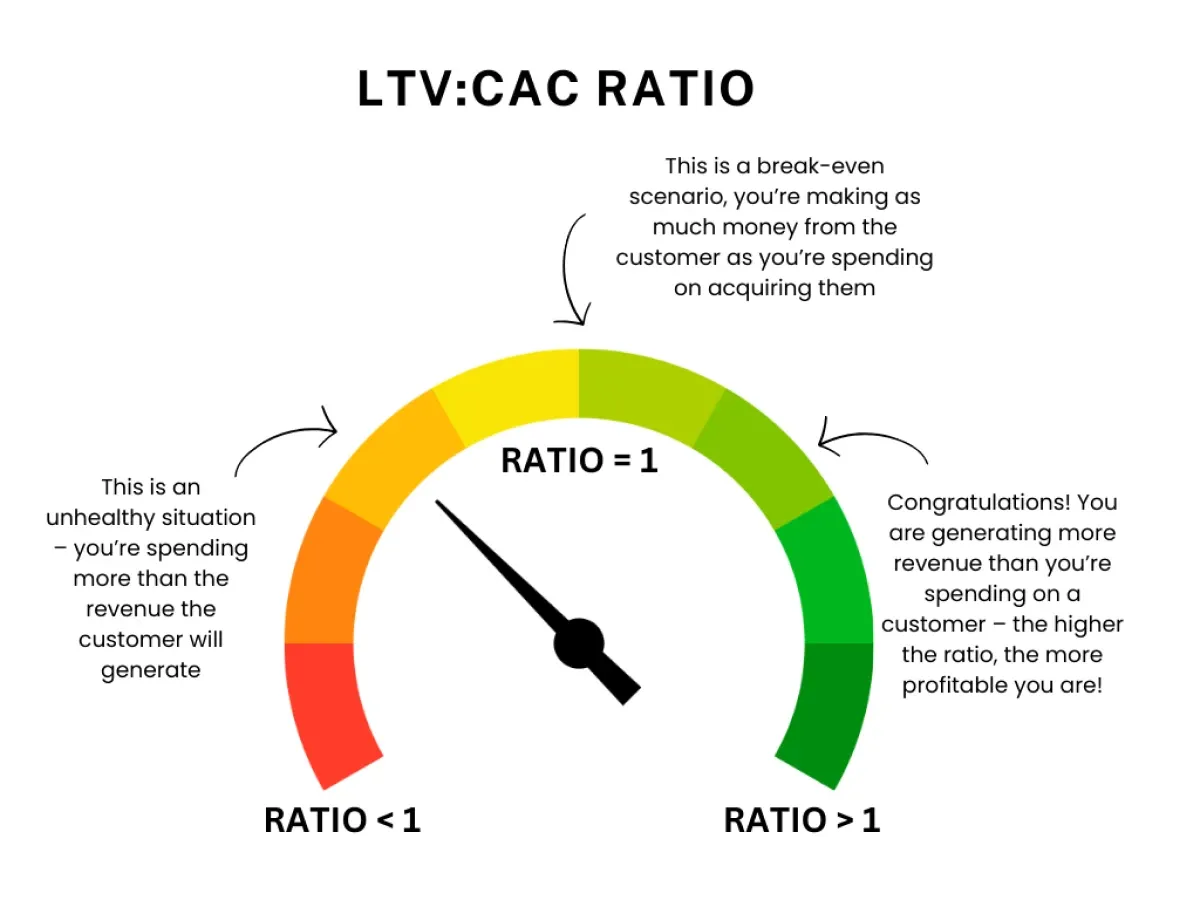
A healthy ratio means that you're acquiring customers for a reasonable cost, so the revenue they generate over time outweighs the initial investment you have to make to bring them on board.
Cohort analysis
Assume that a group of people all signed up for your platform or app on the same day – this is a cohort. Cohort analysis is a technique where you monitor different cohorts over time to learn about their behavior.
Looking at all your customers together can mask important trends – averages don’t tell you the whole story. With cohort analysis, you break down behavior by groups. You can see how users who signed up in March of this year behave compared to those who came in March last year. Perhaps the new ones are churning more quickly. Why is that? Did you have a discount going on last time? Was the onboarding flow easier before? Such insights would remain hidden if you were only looking at averages.
Customer churn
Not all days have fair weather – and customer churn is like seeing a rainy day. It is the rate at which customers stop using your product over a specific period – it means that you have lost these customers forever.
Churn rates can reveal problems with your product’s features or UX, send price sensitivity signals, or indicate that there is a misalignment between user needs and your solution. It is just one of several product adoption metrics that you can monitor to evaluate the health of your product.
Think of customer churn not as a number but as a call to action. Not only do you need to know this statistic, you need to dig into the reasons why someone is leaving you. Exit surveys or 1:1 feedback from churned customers can expose underlying problems or changing needs.
The power of SaaS reporting
Saas reporting is not just about the numbers – it is about getting to the heart of what is working and what isn’t. By tracking and analyzing key metrics you gain a 360-degree understanding of your business’s health as well as the efficiency of initiatives being undertaken by your product, sales, and marketing teams.
This knowledge helps you optimize your sales funnel. You can improve your lead generation and nurturing processes. You can develop marketing campaigns that are laser-focused to appeal to specific segments for the right spend. You move beyond gut instinct and guesswork – and instead, look at the evidence to make strategic decisions.
At the end of the day, SaaS reporting is useful both for internal consumption of different departments and senior leaders, as well as for partners and investors.
Use the insights you uncover from your SaaS reporting to continuously improve your product, refine your marketing initiatives, and prioritize projects that deliver the most value for your customers, ultimately creating a win-win scenario for both yourself and your user base.