


Customer expectations are higher than ever, so companies no longer have the luxury of sitting back and responding to customer needs as they arise. The traditional reactive approach to customer experience (CX) insights—waiting for trends to emerge and issues to manifest before taking action—has shown its limits.
Jeannie Walters, one of the biggest voices in customer experience, has advocated to “turn number-watching into something more proactive.” Teams are often addicted to running through their numbers at the end of the month to see what their customer experience looks like overall, but far fewer actively invest time into digging into the story behind the numbers.
A simple shift from a reactive to a proactive customer experience management mindset is all that’s needed to transform your ability to deliver incredible, loyalty-building experiences.
This trend is occurring across all industries. While customer experience has had its heyday for the last few years, it began to fizzle out in recent years due to the commonly intangible metrics they’re held up by.
A proactive approach to customer experience seems to be reinvigorating the industry, renewing companies’ confidence in customer experience as a real needle-mover.
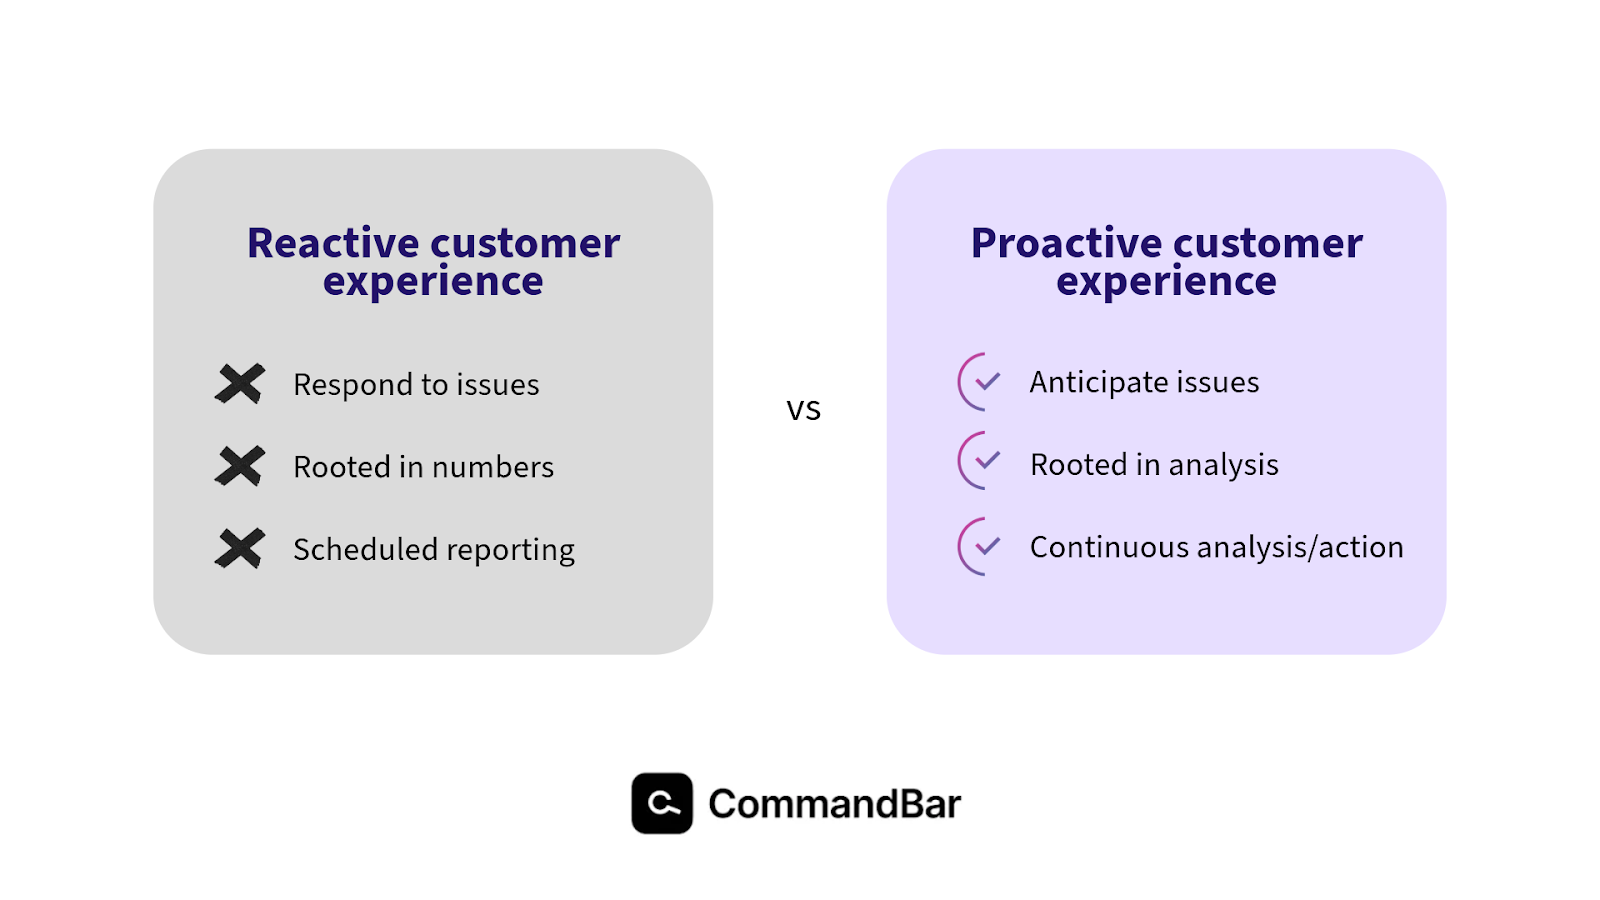
This approach trumps the reactive approach of the past by delivering:
- Better, more consistent customer satisfaction
- Reduced support costs
- Better product quality
- Better customer retention.
What metrics are on a proactive CX dashboard?
The metrics you track and the processes for how you put those into action are at the heart of proactive customer experience management. Armed with the right metrics, you can get ahead of evolving customer expectations and anticipate ways to continue crafting better experiences.
A whole slew of metrics are included on your typical customer experience dashboard. Things like your Net Promoter Score (NPS), Customer Satisfaction Score (CSAT), and ticket volume/response time are common for teams looking back to get a temperature check on their customer experience.
And while those metrics are still important to continue to track, here are some more meaningful metrics to add on that help you dig into the “why” behind your customer experience rather than just the “what.”
Real-time data visualization
One main theme to note here is that all of these metrics must be available in real time. You need an in-the-moment view that makes it easy to catch trends as they’re arising and intervene in a timely manner.
So now let’s get into some of the actual metrics we’d recommend including.
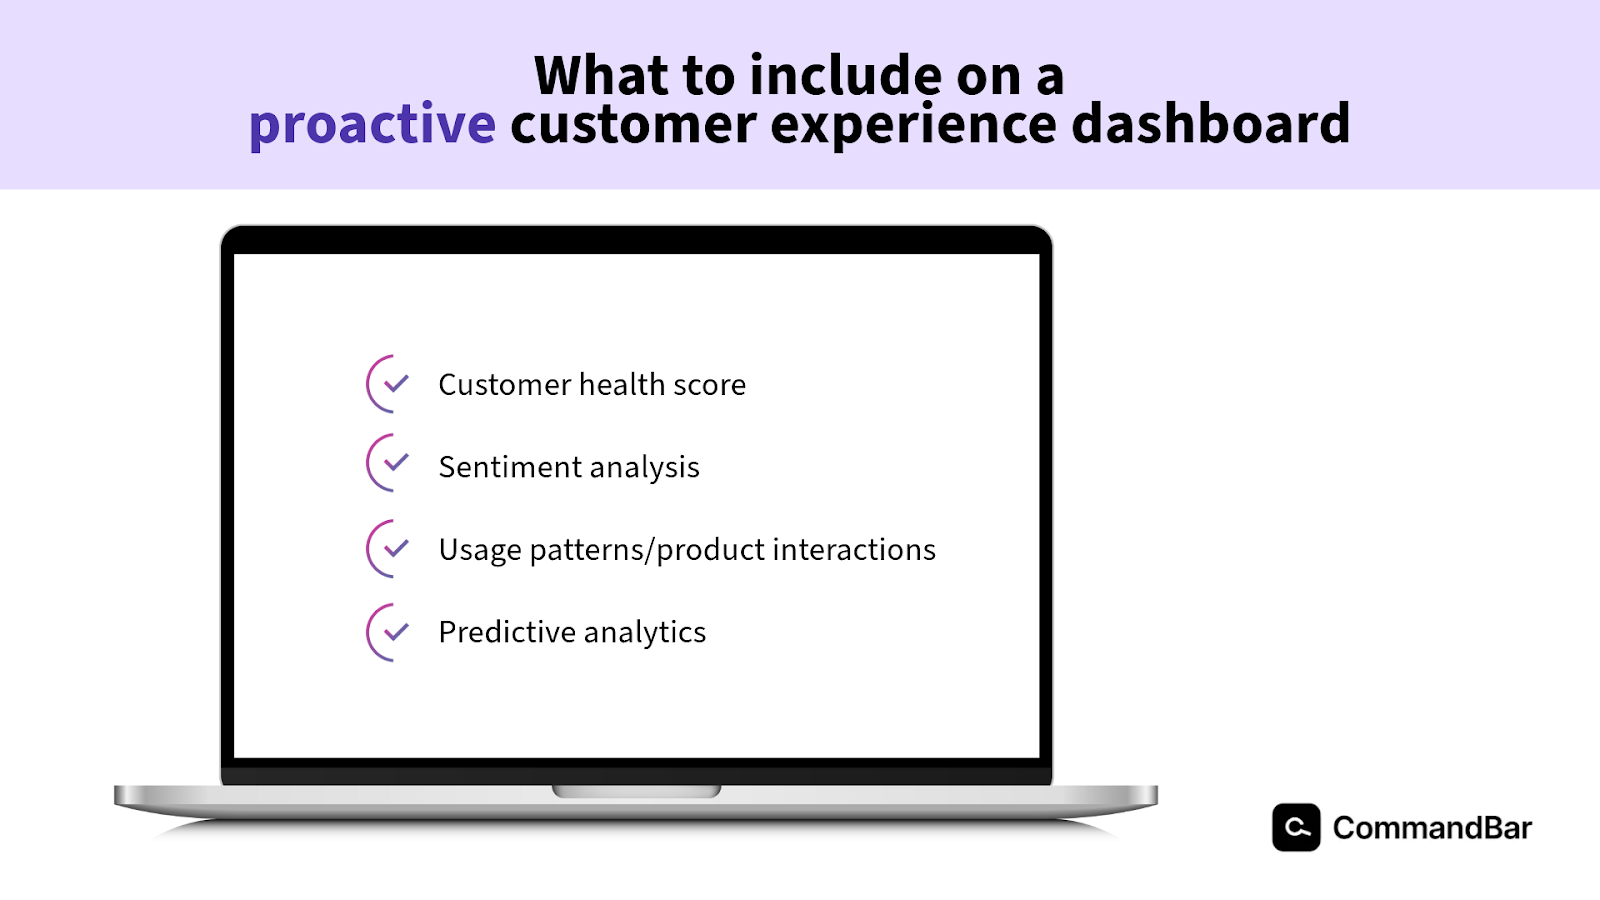
Customer health scores
A customer health score is a combination of various metrics that give you a holistic view of a customer’s current status as well as potential future behavior. A customer’s “health” is closely tied to the quality of the experience that you’re providing them, so a decline in health is a clear need for action.
What makes a “healthy” customer at one company may look vastly different than at a different company, so there’s no one-size-fits-all suggestion for the metrics to roll into your customer health score.You essentially want to wrap together all of the indicators of a highly engaged customer in your specific platform.
As a rule of thumb, though, here are some common metrics that are accounted for in the customer health score:
- How long they’ve been a customer
- Account growth over time
- Number of times they’ve been upsold
- Product or service usage
- Feedback they’ve provided
- How often they contact support
- Engagement with marketing efforts
Sentiment analysis
Sentiment analysis, sometimes also referred to as opinion mining, is the transformation of lots of raw data into indications of positive, neutral, or negative feelings towards your offerings.
Natural language processing platforms can pull text from emails, tweets, survey responses, chats with your support team, online reviews, and many other sources to determine your customers’ sentiments.
This is a very critical metric to include on a proactive customer experience dashboard because it digs into the overwise intangible: their emotions. Even if all of your other vanity metrics are pointing to a great customer experience, sentiment analysis may indicate a need to dig a little deeper into how your customers are really experiencing your brand.
Usage patterns and product interactions
They always say that actions speak louder than words, and there’s no difference when building your customer experience dashboard. Integrate many trackers of how your users are interacting with your product to dig into their tactical experience.
This can include things like heatmaps, click tracking, and time in-product. You may also want to include charts of events that are specific to high-value actions in your specific product, like exports, shares, sends, etc.
You may also want to include other metrics that indicate their level of adoption or level of engagement in your product. This may include some of the metrics already mentioned above, but also meaningful interactions with your support materials or click-through rate from helpful pop-ups in your product.
You can use these metrics to identify aspects of the experience that are truly engaging, and areas where you may need to improve.
Predictive analytics
While much of your proactive customer experience dashboard will focus on taking action at the first sign of an issue, predictive analytics can actually help you anticipate problems before they even arise.
By incorporating machine learning models and statistical algorithms, predictive analytics can analyze historical interaction data (i.e. all of the other metrics we’ve already mentioned here) to forecast future customer actions and preferences. This helps you identify patterns that predict customer churn, anticipate purchase behaviors, and tailor marketing and product strategies to individual needs.
For example, a CX dashboard equipped with predictive analytics can alert you to a potential drop in customer satisfaction based on subtle shifts in engagement metrics, empowering you to quickly take action.
This predictive approach helps you double down on avoiding mere reaction and instead strategically and actively shaping your customer experience in real time.
Layer on contextual information
One important component is to include contextual information so that you can get more granular about your CX insights and interventions. While you may want to track metrics on a broad level for a good overall temperature check, without any additional segmentation, you run the risk of muddying up your insights.
One group of people may have an incredible overall customer experience, while another may be struggling, and not adding contextual segments robs you of the ability to see these specific insights.
We’d always recommend segmenting by any relevant factors, like persona, product, region, role, or point in the customer journey.
Building your dashboard
When it comes to building your actual, physical dashboard, there are a few things you need to consider.
First, you need to choose the right platform
There are dozens of different customer experience dashboard platforms that you can use, and they all have their pros and cons. Here are some of the best options, and who they may be best for.
Adobe Analytics is best for highly digital-centric businesses that need to deeply understand web and app user engagement.
Power BI is ideal for organizations that are already using Microsoft products because it makes for easy integrations, on top of the added convenience of your familiarity with the Microsoft interface.
Zendesk Explore is best for businesses using Zendesk for customer support and service, because it helps you leverage your existing data for really detailed and up-to-date insights.
Google Looker Studio is perfect for startups and small businesses looking for a cost-effective solution without needing existing data integrations, since it automatically integrates seamlessly with other Google services like Google Analytics, Adwords, and Google Sheets.
Tableau is the best choice for businesses that want to get into really complex data analysis and visualizations that are easy to understand and share across teams.
Integrations
The data that you’re feeding into a good customer experience dashboard will come from a variety of sources, like your CR, your help desk software, and your user assistance platform, to name a few. So you want to make sure that whatever platform you choose can accommodate the integrations you need.
And you want to make sure that these integrations are set up in the right way to ensure accuracy and timeliness.
Leverage your CX dashboard for continuous improvement
As we mentioned before, the problem with a typical, reactive customer experience dashboard is that teams often stop at pulling the numbers and maybe reporting them to their boss. Even if you set up the perfect dashboard, it’s what you do with it that will truly make it proactive.
Set up alerts
Identify triggers that may signal dips in the customer experience. Program in notifications (whether natively in the platform you’re using or with an automation tool like Zapier) so that you have immediate knowledge of when these moments occur so that you can intervene.
You can also set up positive triggers of indicators of really great CX so that you can harness what’s working there in other areas.
You can also automate part of your customer experience management by setting up automated responses to certain situations. For example, you could implement automated support messages that provide immediate acknowledgment and reassurance to customers when they report an issue. These automated responses could include estimated wait times for support or links to helpful resources.
Be iterative
As technology, your product, and customer expectations continue to evolve, so should your customer experience dashboard. It shouldn’t be a set-it-and-forget-it strategy. You want to continuously experiment with new metrics and processes and update the dashboard to fit your evolving needs.
For example, you may realize that your definition of “customer health” may need to evolve. Or you notice additional opportunities to leverage automation. Or perhaps you realize that automated messages you set up are actually having the opposite of the intended effect and are annoying rather than helpful.
As with any other aspect of business, this iterative approach helps you lean into what works and learn from what’s not working.
Make it part of your everyday routine
This dashboard doesn’t do the work for you, so it’s on you to integrate it into your day-to-day schedule, and if you’re a team leader, to establish the team culture of constantly leaning on this dashboard.
When these habits are established, you’re able to consistently and reliably have your finger on the pulse of the customer experience, making it second nature to consider innovative ways to deliver better, more loyalty-generating experiences.
Customer experience is an all-department operation
Customer experience should not be siloed or delegated to one single department. Whether you’re on the product team, in marketing, or in support, you need to align your CX strategies with all of the other stakeholders involved.
This may require a cultural shift. If your organization typically works in silos, you have to intentionally incentivize consistent cross-departmental collaboration by highlighting the power in partnerships across teams.
Centralized access to the data on your customer experience dashboard can help with a lot of the logistics of this shift, though. A single point of access to all customer-related data ensures that all teams have the power to identify trends and issues before they escalate, as well as shape their ongoing proactive customer experience strategy.